Quantcast
Channel: AppsFlyer
Viewing all 871 articles
Browse latest View live

Setting Up A Web-to-App Banner: Step-by-Step

$
0
0

For mobile advertisers, there are mobile apps, desktop and the often neglected, potentially rich gold mine of ad real estate called the mobile web. As a mobile app developer, I can understand why this space is overlooked: it’s like desktop with a bad user experience and limited processing power. However, mobile web is key because it’s a cost-effective and convenient way to convert high quality web users into highly engaged and loyal app users.

The trick to funneling users to your mobile app from the mobile web is to use an unintrusive but attractive banner and AppsFlyer’s new Banner Generator which makes building a mobile web banner so much easier and faster.  

Adding the banner code to your website is extremely simple, even for mobile developers who aren’t that familiar with web layouts.   

Now, let’s get into the step-by-step tutorial.

STEP 0: Configure Your OneLink

First, go to the configuration section of your AppsFlyer Dashboard and click on Configure OneLink. Follow the wizard to create a new OneLink.

While the deep linking scheme is not mandatory, it is strongly recommended. This scheme will define the routing flow so that AppsFlyer knows where to send your user in every scenario.
To create a deep linking scheme and add powerful, deep linking capabilities to your banner, follow our guide.

Once your OneLink is configured, retrieve the OneLink ID on the main OneLink Configuration page and the new (one)link created, you will need if later on.

STEP 1: Get the Pre-Built Banner Code

 Download the pre-built banner code.

Open the zip file it and grab everything but: LICENSE, demo.html and Read.me files (as they’re not needed).  

 Drop these files into your website root directory.

STEP 2: Create A New Banner File

Create a new file called banner.js  (this file will contain the banner activation code we are going to configure in STEP 3).

 Put this banner.js file inside your js (javascript) folder in your main directory.

The folders’ layout should look like this:

project/
├── css/
|   └── style.css
├── js/
|   └── banner.js
└── index.html


STEP 3: Customize Your Banner

For the purpose of this tutorial, I have created a Web-to-App banner for an app called ‘WingBoard’.  For creating this banner I have configured my banner settings as follows:

Here’s the code I used for creating my ‘Windboard‘ Web-to-App banner. Make sure to customize all highlighted parameters to match your own brand and don’t forget to add the OneLink ID and deep link we’ve grabbed earlier to the routing settings!

 var banner = new AFBanner();
     var settings = {
   // banner settings
   title: "Wingboard",
   subtitle: "Sweet lines to send instantly!",
   app_icon: "img/app_icon.png",
   call_to_action: "Install",
   show_only_mobile: true,


   // attribution settings
   media_source: "banner_pid",
   campaign: "banner_c",
   ad: "banner_ad",
   ad_id: "banner_ad_id",
   site_id: "banner_site_id",
   sub1: "banner_sub1",


   // routing settings
   onelink_id: "LniH",
   subdomain: "wingboard",
   mobile_deeplink: "wingboard://"
};
banner.init("my-banner", settings);
 

Take not of how I’ve set the media_source to be banner_pid in the attribution settings.  This will allow me to track my downloads within AppsFlyer dashboard, which is another great advantage of the mobile web banner!  


STEP 4: Activate The Banner On Your Website

You’re almost finished!  

The only thing left is to add some lines of codes to your website:

Add the following code to your <head> file to enable the banner code within your app:

<script type="text/javascript" src="appsflyer-banner.min.js"></script>
<link rel="stylesheet" href="appsflyer-banner.min.css">

Finally, add this line of code to the <body> of your webpage:

 <!-- At the top -->
<div id="my-banner"></div>
<script src="js/banner.js"></script>

By now, you should be finished and able to see your banner within your mobile webpage but…WAIT! A minute before you send an email to your team about today being the most productive day of the quarter, make sure you don’t skip one critical step — testing your banner.

STEP 5: Test Your Banner

 Has the banner been added on your website?
    If it hasn’t, make sure your OneLink was correctly configured (step 0) and that all
    mandatory parameters (in step 3) have been provided.

 Can you see the banner across the right, desired platforms?  Test with IOS, Android and desktop.
      – If you wish to view the banner on both mobile AND desktop, set your banner
         settings to:
         show_only_mobile: false
      – If you wish to view the banner on mobile ONLY, set your banner settings to:
         show_only_mobile: true

 Is the banner link working? Is it routing you to the app store or to your app?
    If your banner link is broken, make sure that the OneLink subdomain set in
    routing settings (step 3) is identical to the subdomain defined in the OneLink
    configuration (step 0). Any mismatch between the subdomain defined in the
    banner and the one defined in the OneLink Configuration will result in a broken link!

All done!

The post Setting Up A Web-to-App Banner: Step-by-Step appeared first on AppsFlyer.


The Next Step Forward In View-Through Attribution

$
0
0

While many have speculated about the value of view-through and multi-touch attribution, marketers have had limited hard data insights. It’s time we did something about this.

As of today, the AppsFlyer Overview dashboard, raw data reports and raw data APIs all feature segmented click-through and view-through attribution. We strongly encourage you to take a look and see what you can find. Quantify the impact of your view-through and click-based attribution settings. Want to increase your view-through attribution? You can easily increase or decrease your view-through attribution windows in your Integrated Partner settings.

Be sure to reach out to your AppsFlyer success managers with your insights, ideas and feedback. We look forward to hearing from you!

The post The Next Step Forward In View-Through Attribution appeared first on AppsFlyer.

3 New Ways To Boost Your Marketing Tech Stack With Expanded Raw Data and Calculated API Fields

$
0
0

Mobile attribution and measurement data is a key component of the modern marketing tech stack. Raw data and rich APIs allow advanced marketers to import all of their mobile performance data into their internal data platforms and BI tools, developing deeper insights and enriching their cross-channel performance metrics.

To this end, we have a couple of exciting upgrades to share:

  1. You can now create your own KPIs in Master API, thanks to calculated fields.
  2. Expanded raw data reporting! Go back even further with 180-day raw data reports

Below are three new types of analysis now possible thanks to today’s enhancements.

1. Cohort day 7 ROI

Marketers often optimize their campaigns based on their short-term ROI performance. With calculated fields, you can easily customize your Master API feed to report each campaign’s Day 7 ROI. By building this field in Master API, your data will be optimally set up for analysis in your BI. Simple, straightforward and flexible, “calculated fields” puts you, the marketer, in control.

2. Click to specific in-app event conversion rates

While nearly all funnels have the same basic components, many marketers optimize based on conversion rates at specific points along their funnel. For example, a popular ride-sharing app buys much of their media on a CPC model and optimizes towards their first non-discounted ride. With calculated fields, you can easily format your Master API to calculate custom conversion rates from any point in your customer journey to any conversion point. With calculated fields, there is no limit to how you can use your data.


3. Deeper marketing insights and smarter multi-touch attribution

Most marketers have found incredible value in their raw data reports, and with your new expanded 180 days, your insights will be even richer. The depth of raw data reports allows marketers to analyze performance based on considerations not available in the dashboard, such as phone model, city, wifi state or mobile carrier to improve your targeting or discover new user persons.

To learn more about these updates, please contact your Success Manager or schedule an AppsFlyer demo today.

The post 3 New Ways To Boost Your Marketing Tech Stack With Expanded Raw Data and Calculated API Fields appeared first on AppsFlyer.

Top 10 Things to Look for In An Attribution Provider

$
0
0

If you’ve opened this post, you’re already sold on the importance of attribution to your mobile app business. Check. Actually, important is an understatement. Attribution can mean the difference between success and failure.

Sounds dramatic? Maybe. But this is a serious decision, and if you backtrack later and migrate to another provider, you’ll have to spend time and resources on SDK implementation, set-up, media configuration, in-app event configuration, deep linking, and on and on and on.

So choose wisely. But you’re not on your own. Hopefully, this Top 10 will help make your decision a little easier…


1. Official Measurement Partner of All Top Media Companies, Including Facebook and Google

If you’re doing paid user acquisition campaigns, your attribution provider should be an officially recognized measurement partner of all the top media sources: FB/Instagram, Google, Twitter, Snapchat, and the Chinese giant Tencent.

The top media sources, especially the big 2 — Facebook and Google — work with measurement partners who add significant value to their advertiser ecosystem through cutting edge innovation and service excellence. And they are thoroughly vetted for their capabilities, expertise and a solid track record of success. They are also held to high standards of data security and regularly audited to ensure they uphold these standards.

You should draw an important distinction between providers by looking at their depth of integration with these top media sources. Ideally, it should include impressions, clicks, cost, and the ability to automatically run audience campaigns such as retargeting (AKA Custom Audiences) and lookalike targeting. Measuring cost in particular is key to understanding the full ROI on your marketing efforts.


2. Scale and Market Share to Block Fraud

As mobile ad spend grows, fraudsters become more and more incentivized and emboldened. They are constantly developing new types of mobile ad fraud, stealing both organic and non-organic users through techniques such as click flooding, install hijacking, and faking users with device ID reset fraud. A recent AppsFlyer study shows that in 2017 just over 10% of installs globally were fraudulent, and app install fraud cost advertisers between $2.2-$2.6 billion.

How Serious Are They About Fighting Fraud?

Fraudsters have become increasingly sophisticated, adapting at alarming speeds to new developments in fraud defense. This means that your attribution provider should be serious and meticulous about always staying up to date with new types of fraud. How serious they truly are will be reflected in their allocation of resources, tools and expertise to fight fraud. But most importantly, effective anti-fraud efforts should be centered around:

  1. Massive cross-network scale and significant market penetration
  2. Machine learning to pull actionable insights from the data

In the end, your provider’s fraud solution should focus primarily on blocking but include post-install detection when real-time blocking is not possible.

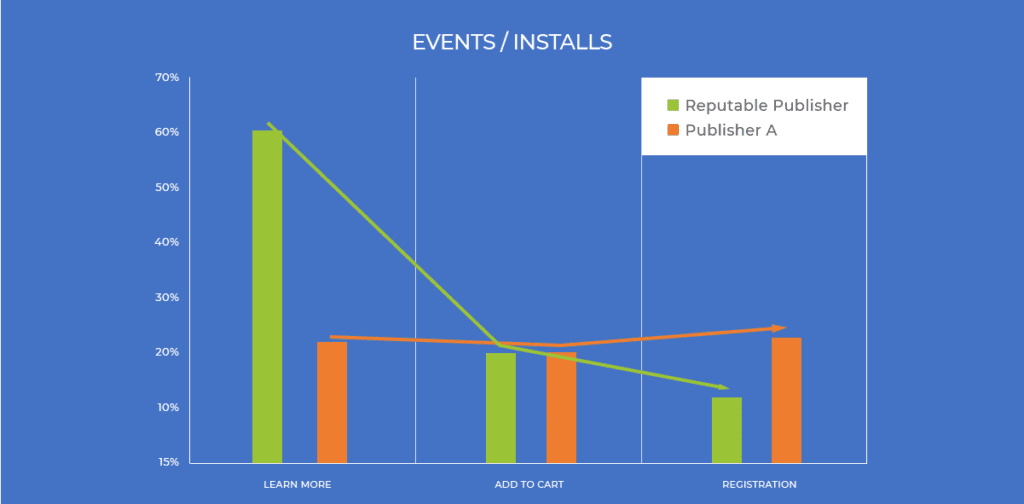
Multi-Touch Attribution to Maximize Fraud Detection

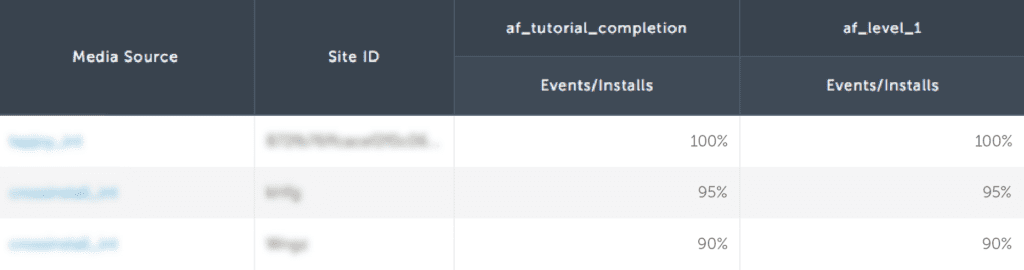
Multi-touch attribution identifies sources before the last click that contribute to installs. This technique enables visibility across the user journey which helps optimize ad spend. It is also an important indicator of fraud; in particular, click flooding.

Click flooding involves sending a high volume of clicks, few of which correlate with an install. Media sources that engage in click flooding have unusually high contributor rates. Only attribution and anti-fraud providers with multi-touch attribution can calculate contributor rates.

Secure SDK

Finally, look for attribution providers with a secure SDK. Open source SDKs can be easily manipulated and exposed to fraud. When the code is visible to everyone, everyone means fraudsters as well. This is why It is important to make sure the attribution provider you choose uses a closed source SDK that is not exposed and cannot be easily reverse engineered. This makes it harder for fraudsters to attack.


3. You Should Be Given Access to Your Raw Data

Not all attribution providers offer raw data, and you must be able to access it. Raw data reports are like rough uncut diamonds for mobile marketers that can be cut and shaped into countless marketing and user behavior insights.

When we explore data, we often refer to two types: aggregated and raw.

Aggregated Data Is Not Enough

Why do you need these seemingly endless rows and columns of numbers if aggregated data on the dashboard already ties it all together? After all, insights are gathered from patterns, not specific users. Here’s why: Aggregated data is valuable. It’s clear, easy-to-use and offers quick, actionable insights. But it’s not enough. You also need data in its purest form — raw.

Create Highly Targeted Lists of Users to Customize Data Analysis

Raw data, for example, lets you create highly targeted lists of users you can use in audience campaigns. Aggregated data is in-depth, but you may want to customize your data analysis to your unique needs. You can mold raw data any way you like to get deep insights into different audiences, their behavior and lifetime value.

Raw Data Let’s You Discover Insights You Might Not Have Otherwise Discovered

Nobody knows your app or your customers like you do. Spend a little quality time getting to know your raw data. You’ll be surprised what’s there; and the marketing possibilities that await you: new market segments you hadn’t identified, new cohorts to optimize, a fresh set of challenges to address, new opportunities to act upon, etc. not all attribution providers offer this access.

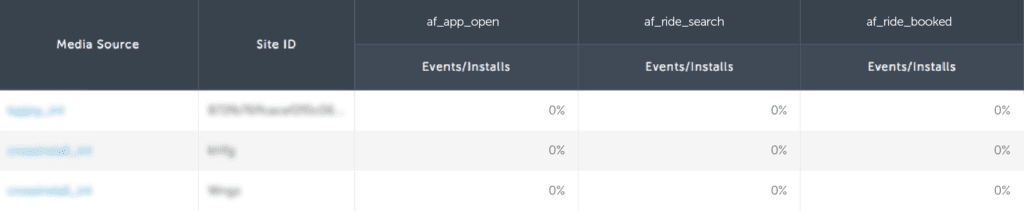
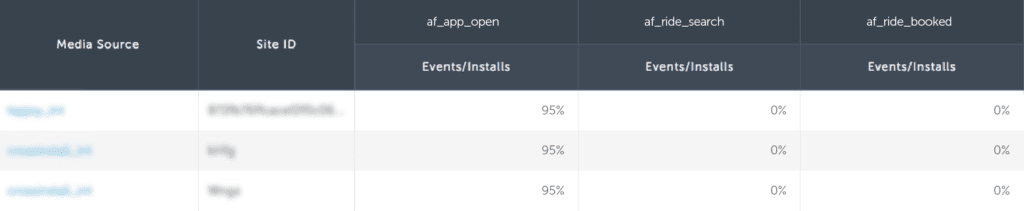
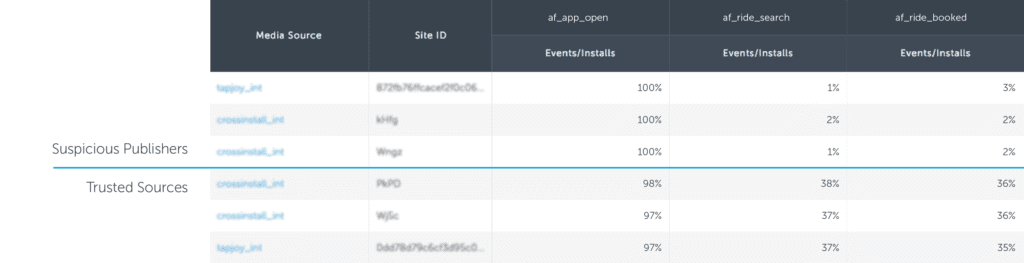
Raw Data Helps You Fight Fraud

Raw data lets you fish out suspicious patterns, parameters or trends like installs or unique identifiers from the same IP, illogical timestamps (every second, every 5 seconds, etc.) and a lot of IDFAs for a single IDFV (identifier for a vendor). You can identify and resolve issues with in-app activity or postback fraud. You can also look for similar patterns in your device-level data, such as the device name, operating system, OS version and geolocation.

With Raw Level Data Comes … Freedom!

Your data is your most valuable asset. And just to be clear, it’s yours. You own it. Or at least that’s how it should work. If one day you choose to move to another vendor, if you have access to your raw data, you can just take it and move on. Without raw data, you are bound and chained to a specific vendor that has all your data and the power to decide its fate.


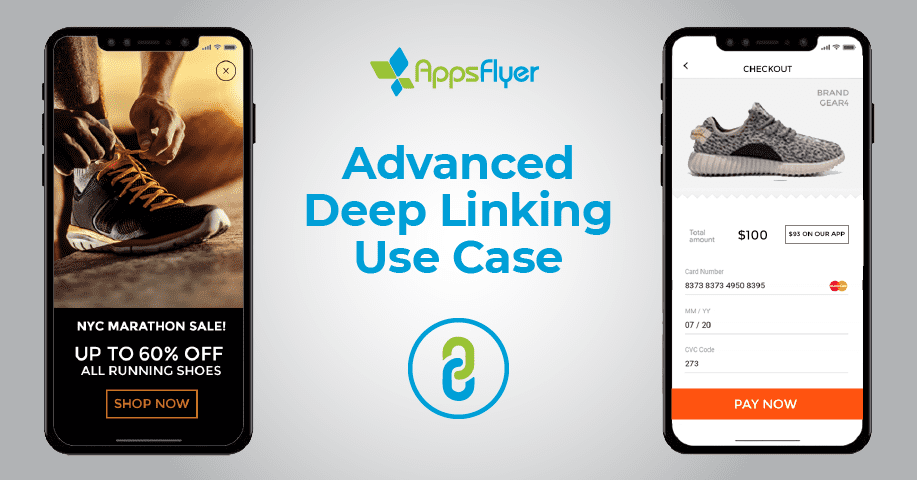
4. Proven, Reliable Attribution That Includes Deep Linking

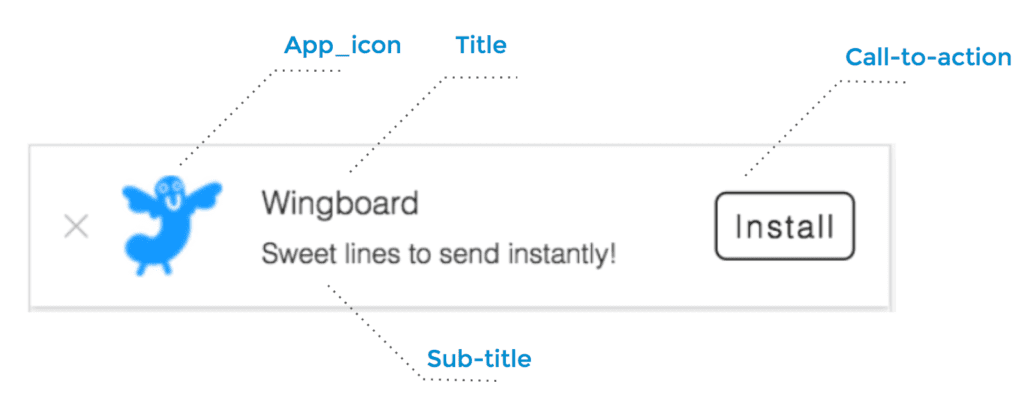
If you know anything about deep linking, you’re probably sold on its benefits for mobile app growth and user retention. Just a few years ago, deep linking was a novel and complex technological innovation. Today, it’s pretty standard fare. All of the major attribution providers offer basic to advanced deep linking capabilities.

First Consider Attribution; Then Deep Linking

So when you’re choosing an attribution provider, ask about deep linking. But your primary consideration should be attribution. And by the way, these two components should not be divided among two vendors (more on this below).

When considering attribution, ask yourself, how experienced are they as an attribution provider? How many features do they offer? Can they handle scale? How many ad network integrations do they have? Do these include official measurement partner status with all the big media sources?

Doing attribution right takes years of research and technical development and building integrations and relationships with thousands of media sources. This level of scale will allow you the freedom to grow and diversify your marketing efforts.

Stick with One Vendor for Both Attribution and Deep Linking

As I alluded to above, there’s no point in doing deep linking with one vendor and attribution with another. Keeping the two under one roof has clear benefits: lower cost with one provider, one dashboard that shows all attribution and click data from your deep links, consistent reporting, data is easier to analyze, and it is easier to pipe information to a customer data platform.

5. Unbiased: No Media or Data Marketplace Business

You must be able to have complete trust in your attribution partner. After all, your mobile advertising strategy will be based on data they provide. How can you be sure this data is impartial, and therefore 100% accurate?

Before you sign the dotted line, you should ask these basic questions: Do they have financial relationships with ad networks? Does part of their business involve media buying and selling in a marketplace?

Attribution providers can be broken down into two categories: biased and unbiased. Biased providers also engage in selling of data or buying and selling of mobile ad media. This can create conflicts of interest and impartial business practices. No matter what they sell you in their pitch, you should dig a little to clarify whether their core business is exclusively attribution or if they have vested interests in other parts of the mobile advertising ecosystem.

Unbiased attribution providers only do attribution. Period. This ensures impartiality and independence. They can be trusted to measure and report on campaign performance and settle any reporting discrepancies by players on both the buy and sell sides of mobile advertising.


6. A Breakdown of Cost Data

Read carefully. The accuracy of your ROI measurement will depend on this: Do not settle for receiving cost data per campaign. Instead, make sure you can get access to cost data by ad group, creative versions, location, and publisher. The greater the granularity, the more data you’ll have for optimization.

Make your attribution/measurement provider insist on getting comprehensive cost data such as pricing model, value and currency. And make sure they are able to properly track this information and record it as money spent when installs are credited.

You also want your attribution provider to have a long list of network integrations for cost data. Why? The more integrations your provider has with cost data, the more likely the networks you work will be on that list. Your provider’s cost data integrations should include the top networks: Facebook, Google, Snap, and Apple Search Ads, etc.

7. Advanced Fingerprinting with Flexible Lookback Windows

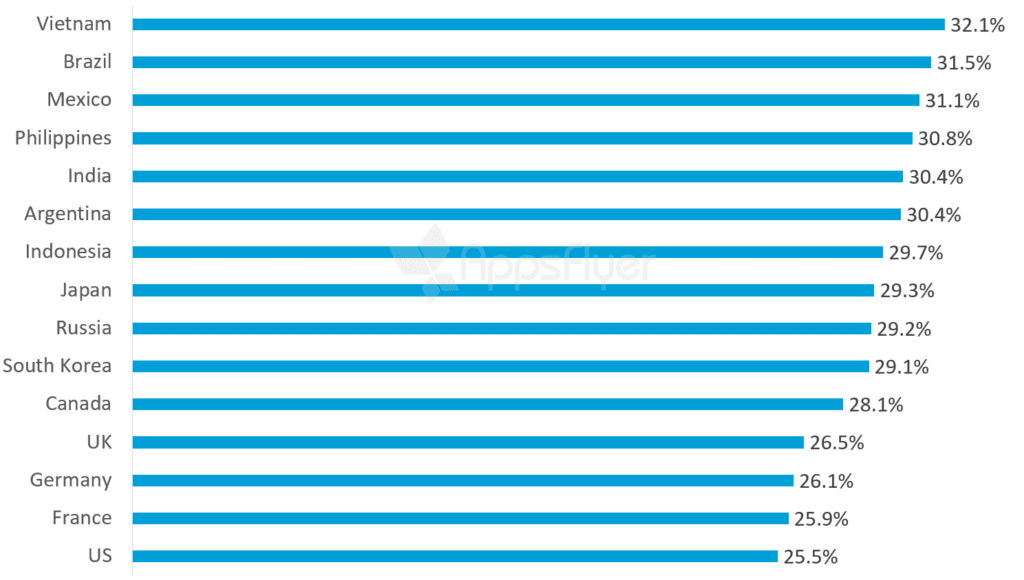
Fingerprinting is an important part of mobile attribution. But it must be done accurately. Look for an attribution provider that knows how to change lookback windows dynamically to maximize accuracy.

Fingerprinting is commonly implemented specifically in public spaces such as airports where hundreds, thousands and even tens of thousands of users share the same IP address. IP address data is a major component of fingerprinting solutions, but it is often misleading, causing massive false attribution. When the pool of devices is too large, fingerprinting loses accuracy, reliability and and value.

To make matters worse, some attribution providers use fingerprinting even when device IDs are present on a click. Since fingerprinting should only be used as a fallback method when identifiers are missing, this becomes a missed opportunity to ensure attribuon accuracy.

So what is adaptive fingerprinting? An install from a home WiFi network shared by only two mobile phones is given a longer attribution lookback window. An install from a more popular and therefore less unique IP address is given a shorter window. When IP addresses are shared by thousands or tens of thousands of users, fingerprinting is not reliable and these populations of users are removed altogether.

The Bleeding Cash Cycle

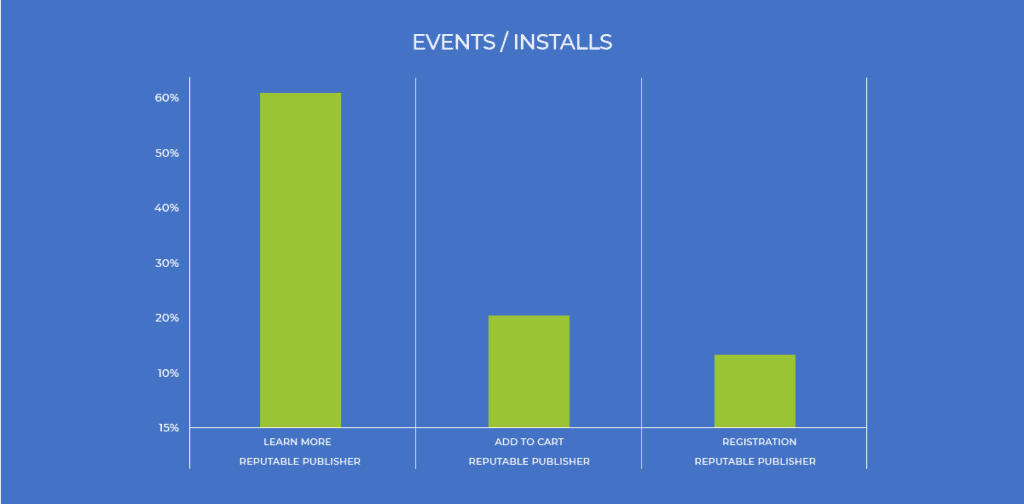
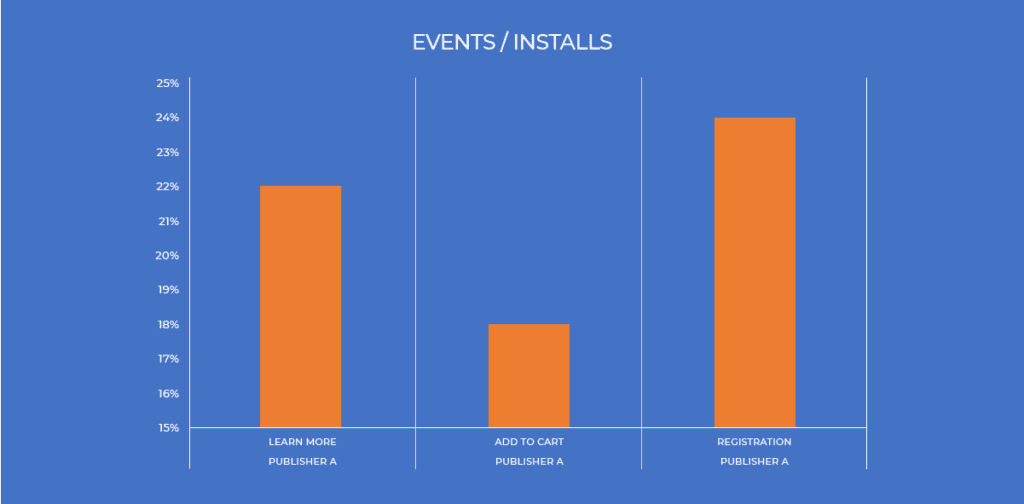
The best attribution providers take accuracy very seriously. Ideally, they should use advertising IDs (the most accurate methods) as the go-to approach and only use fingerprinting as a fallback. Some providers will do attribution with IP or partial IP fingerprinting. This is a classic case of attribution providers cutting corners for their bottom line. This creates a lot of false positives, creating a situation in which advertisers bleed cash they could be pumping back into user acquisition and re-engagement.

When poor fingerprinting attributes organic installs as non-organic, advertisers find themselves in a “bleeding cash cycle.” In a bleeding cash cycle, misattributed organic installs falsely show strong UA campaign performance, and businesses invest in the wrong places. This drains budgets today and wastes tomorrow’s ad spend.

Recently, some of the largest global advertisers discovered that false attribution had doubled the cost of their media. Poor attribution technology was to blame.


8. Segment Existing Users to Boost Your User Acquisition

When you consider attribution providers, make sure you understand how comprehensive and effective their platform is when it comes to segmentation. They should help you build on the audiences you have and discover new audiences. They should provide deep, granular data to make segmentation both easy and rewarding. With granular segmentation, you can use rich in-app events to group your highest quality users. This has a tremendous effect on your ROI.

Effective segmentation will improve your app’s performance by enabling retargeting, lookalike targeting, uninstall recovery, exclusion targeting, cross-app promotions, and better informed decisions on creatives and budgets.

Your provider should also have the ability to fully automate the process of transferring segmented data to your media partner.

9. Configurable Dashboard That Provides Actionable Insights

A well-designed dashboard lets you extract actionable insights instantaneously, using configurable visualizations to paint clear pictures. Your attribution dashboard should make it easy to understand what your next course of action will be: do I need to shift my budget around? Do I need to stop a specific campaign? Am I being hit by fraud? The answers should literally jump off the screen. Without a dashboard that can tell you the right story through visualizations, it’s easy to get caught drowning in a sea of data, searching for pieces of a large puzzle; left to fend for yourself.


10. The R&D Team Is Much Larger Than the Sales Team

This is a question of values over bottom line. Here’s a way to get a sense of if the attribution provider is truly focused on your success as an advertiser (to be clear, all attribution providers will claim that your success is their focus and mission).

Take a look at the size ratio of the provider’s R&D team vs. their sales team. If they have a significantly greater number of R&D professionals, this means they are more focused on always innovating and improving their products. It will also indicate their capacity to release new features more often (which improves your experience). These providers are primarily focused on their customers’ success rather than their bottom line.

All 10 points boil down to one simple question: Who can you trust to be (obsessively) focused on one thing and one thing only — the success of your mobile app business.  

The post Top 10 Things to Look for In An Attribution Provider appeared first on AppsFlyer.

Unmasking The Next Generation of Mobile Fraud #FoolsNoMore

$
0
0

On April 1st, the tech industry celebrated April Fools Day. Today, April 2nd, we declare that we are #FoolsNoMore. As marketers, we are sick and tired of mobile fraud and we aren’t going to fall for the same old pranks anymore. To kick this off, we are opening our doors, sharing never-before-seen insights into how fraud works, where it hits, where it’s heading and how we tackle these emerging issues with Protect360.

Back in November, Forrester reported that mobile marketers’ biggest challenges are data visibility, a lack of knowledge, a lack of transparency and mobile ad fraud. Today, we are going to close that fraud gap. Today, we are #FoolsNoMore.


Fraud Is Evolving and Growing

Fraud is evolving faster than ever before. In 2014 fraudsters tried spoofing our SDK, so we added encryption and shut it down. It took fraudsters almost six months to find a new attack vector. In contrast, fraudsters now adapt to new anti-fraud solutions in weeks, and sometimes even days.

To compound matters, fraud isn’t just getting faster, it’s hitting harder. In September, we predicted that by the end of 2017, 1 in 10 attributed installs would be driven by fraud, exposing the industry about 2.2 – 2.6 billion dollars in annual loss. By the end of Q1 2018, we passed an 11.5% global fraud rate, a 15% jump from the 2017 average fraud rate. However, this figure can be misleading. Rising CPI rates and overall industry growth has increased the financial impact of fraud by 30% exposing in between 700 and 800 million dollars in mobile advertising to fraud over just three months!


Fraud Comes In Waves: The Rise of Bots

Fraud comes in waves. When a marketer is found to be vulnerable, fraudsters will generally double down, hitting even harder. When new protection hits the market, fraudsters are forced to adapt.

When we introduced Protect360 in September 2017, DeviceID Reset Fraud rates were very high. These rates quickly dropped as fraudsters tested new DeviceID Reset Fraud patterns, and new fraud types. Though we saw fraud attack vectors evolve, the old techniques never really went away. In early Q4 2017, there was a resurgence in nearly every type of fraud. With this sudden resurgence, a number of bots tried to spoof our SDK in limited pockets around the world. While many of these bots were blocked, we geared up for a new wave of bot innovation.


Scaling and Automating Protection For The Next Generation of Fraud

Over the last six months, we have partnered with leading mobile businesses, diving deep into new anomalies and emerging fraud types, as well as finding and testing new fraud signatures using our proprietary, cross-publisher database. Since launch, our Protect360 database has grown to over 5.7 billion devices and over 1 trillion monthly events. Thanks to this scale, we are able to detect and block new fraud types, including bots and behavioral anomalies with unmatched speed and effectiveness.

This investment in data-centric innovation has born remarkable fruits. We partnered with Google to introduce the new Google Referrer API and started blocking referrer hijacking, a new class of install hijacking. In addition to upgrading our protection against install hijacking and introducing customizable install hijacking protection with Validation Rules, we automated our click flooding protection. With the recent resurgence of bots, we added additional security measures to our SDK as well as automated blocking based on our proprietary bot signature database. Thanks to the unique scale of our database we further developed a new technology that automatically detects behavioral anomalies, and will soon roll out automated protection against sources trafficking this non-human activity. In response to changing DeviceID Reset Fraud patterns, we updated our DeviceRank algorithms a number of times, blocking more fraudulent activity with each update.


Protect360 is now automatically blocking
over 5x more activity than just six months ago.


Bottom Line

The game has changed for anti-fraud providers. Rather than building and deploying new fraud solutions on a typical agile model, releasing new fraud protection every few months, we must now operate like anti-virus providers, continuously scanning data, finding abnormalities and updating our protection.

To help you tackle mobile fraud, be sure to download The State of Mobile Fraud, a comprehensive study on how mobile fraud works, where fraud hits the hardest and which geos and verticals are most exposed. To learn more about Protect360 and receive a complimentary fraud assessment, please schedule your consultation today.


The post Unmasking The Next Generation of Mobile Fraud #FoolsNoMore appeared first on AppsFlyer.

The Rapid Evolution of Mobile Fraud #FoolsNoMore

$
0
0

On Monday, we kicked off the #FoolsNoMore initiative, a new annual initiative that educates and empowers marketers with fresh insights and recommendations for combatting mobile fraud.

Today, we are going to take a deeper dive into the changing face of fraud. While Device Farms remained a major threat in Q4 2017 and Q1 2018, we also saw a serious resurgence in bot fraud, as well the emergence of behavioral anomalies.

When we introduced automated protection against Device Farms and DeviceID Reset Fraud, this was the most common type of mobile fraud, representing just over 50% of all mobile fraud. Within weeks of the release, DeviceID Reset Fraud levels dropped dramatically. Over the following weeks, fraudsters changed their install patterns continuously attempting new attacks, and we repeatedly updated our DeviceRank algorithms, blocking even more fraud along the way.

Facing declining performance, fraudsters started experimenting with alternative attack vectors. They began sending hybrid attacks that utilized multiple attack tactics in tandem. They adapted to new protection solutions with remarkable agility, at times evolving in just days.


Q4 2017 – Q1 2018: Addressing The Rise of Bots and Behavioral Anomalies

To address the recent resurgence of bots, we enhanced our real-time bot protection, and developed a new technology that actively flags behavioral anomalies. The first generation of our new behavioral anomaly detection technology helped unmask new bot signatures.

For example, consider the bot below. This bot typically strikes at relatively low volume, across a very wide spectrum of apps, verticals and geos. By slowly draining a diverse set of campaigns across media sources and businesses, this fraudster effectively avoided protection for quite some time. However, because of the scale of our database as well as our anomaly detection platform, we were able to accurately identify and block this advanced bot.

Moving Beyond Bot Signatures, Developing Behavioral Analysis

Blocking a known bot signature is relatively straightforward. However, after months of research we have found a number of behavioral patterns that are clearly fraudulent, but do not share an identifiable common metadata signature that can blacklisted – other than the sub-publishers that are sending the traffic.

With the help of our new behavioral anomaly detection technology, we have tested and validated multiple new fraud behavioral patterns that are undetectable using traditional fraud prevention measures such as bot signatures or CTIT distribution. By analyzing post install behavior, such as event type, volume, engagement patterns as well as matching metadata, this solution automatically identifies emerging anomalies for further validation. Over the coming weeks, Protect360 will begin automatically blocking sub-publishers sending this clearly artificial traffic.

Early next week, we will share some additional insights into how we validate every fraud signature, optimizing marketer coverage without sacrificing data accuracy to false positives. To learn more about Protect360 or to schedule a complimentary consultation with our Protect360 team, please speak with your success manager or contact us today.

The post The Rapid Evolution of Mobile Fraud #FoolsNoMore appeared first on AppsFlyer.

The Dangers of Blocking Fraud in Real Time #FoolsNoMore

$
0
0

As an attribution provider, both marketers and media sources trust us to measure and report their performance. While marketers would like to block 100% of  fraud in real-time, there is a risk in overzealous blocking as well – damaging publisher relationships, ad network revenues and data accuracy. Today, we will take a deep dive into how we identify and validate every fraud signature, delivering optimal coverage without compromising your data accuracy.

Our Protect360 team operates like an antivirus or cyber-security solution, rather than your standard SAAS product team. Most of our R&D team operates on an agile release process, testing and releasing product updates in standard sprints. However, our Protect360 team is expected to take action in fraud in near-real time, blocking emerging fraud sources without compromising data integrity. This requires a far more agile, and vigorous update cycle.

By transparently blocking fraud in real-time, marketers save both time and money. Behind the scenes, maintaining real-time protection against bots, click flooding, install hijacking, behavioral anomalies and device farms is challenging. Blocking fraud requires (a) a massive data set for analysis, (b) supervised and unsupervised machine learning that can detect new and emerging anomalies and fraud patterns and (c) deep experience in mobile advertising, app marketing and fraud industries.

Not Every Anomaly is Fraud

Given the fragmented nature of mobile marketing, there are dozens of points of failure, any one of which could set off false fraud alarms. Unsupervised machine learning is great for detecting anomalies, but treating anomalies as fraud would be dangerous and misleading. Something as basic as a server delay or an external API bug can result in abnormal activity, even though no fraud has occurred. Knowing when and what to block without compromising data quality and integrity is very difficult. Every new fraud signature suggested by our automated system undergoes extensive testing and validation by our data scientists. In order to validate that an anomaly was the result of fraud and not a technical error or edge case, our data scientists must consider dozens of potential points of failure, comparing data across thousands of campaigns and advertisers. Given the speed and agility of today’s mobile fraudsters, everything from our SiteID blacklists to our click flooding protection and bot signature database must always be up to date, protecting against the latest and greatest threats as they emerge.

The Data To Map The Mobile Fraud Genome

Protect360 is powered by our unique mobile engagement database. We now process over 1,000,000,000,000,000 (1 trillion) mobile events every month across over 5,700,000,000 (5.7 billion) devices. These aren’t just big numbers, they are key to our ability to find and block fraud.

Consider the following analogy. One hundred years ago, physicians diagnosed diseases based on their symptoms. As our understanding of science and medicine improved, the industry began conducting clinical trials that adhered to scientific method, improving results. Thanks to advances, including the mapping of the human genome, genetic testing can now accurately identify which specific diseases and genetic mutations are best treated with specific drugs. In the business world, the only way to accurately identify the root causes of fraud and remove the bad actors without damaging the broader ecosystem is through big data. By carefully calibrating our machine learning, we are better able to find additional variables for each fraud signature. This technique allows us to cut off even the most advanced fraud at its root.

Speed Vs. Accuracy

Finding the right balance between speed and accuracy is never easy. Compromising accuracy for speed is short-sighted and leaves marketers exposed. Our solution has been to distribute the workload.

We invest heavily in global fraud research, innovation and collaboration. Over the last six months, we onboarded additional mobile fraud-focussed data scientists, and founded an internal global task force to find and share potential fraud. Regional fraud leads and CSMs regularly share their new anomalies and advertiser challenges, collaborating with colleagues across 14 global offices. A few team members started exploring outside the box, joining gray hat and black hat cybersecurity forums and dark web meetups, learning how fraudsters avoid blacklists, purchase DeviceID lists, operate and maintain botnets and more. We met with a Russian broker who had visited an Asian device farm and interviewed a US college student running his own device farm to cover his tuition. We also met with partners and networks around the world, sharing insights and learning from our shared experience. With dozens of team members collaborating on fraud challenges and potential solutions, the insights poured in.

Though this investment in resources across Product, R&D, CSM and Support teams has been significant, I am proud to say that nobody has ever questioned the amount of time and effort we put into mobile fraud research, or any of our measurement products. An investment in delivering better data accuracy for our clients and partners is an investment in our future as a measurement provider.

In summary, blocking fraudulent traffic in real-time saves time and money while improving your data accuracy. However, this strategy demands extreme care and precision. Blocking fraud in real-time requires a massive amount of fresh data, as well as deep expertise in both machine learning and the mobile ecosystem. To learn more about mobile fraud, please check out our latest report, The State of Mobile Fraud or book your complimentary fraud consultation today.

The post The Dangers of Blocking Fraud in Real Time #FoolsNoMore appeared first on AppsFlyer.

How to Scale UA Campaigns for Your App Growth

$
0
0
Scaling UA campaigns leading image

Recently, Subway Surfers passed one billion downloads on Google Play, making it the first Android title to reach this milestone. It’s every developer’s dream.

But when you start to scale a UA campaign, there’s always a catch. CPI might suddenly be higher than expected; CPM is already sky-high; and ROI is average, at best. The truth is, creating great campaigns in your home market is tough; but it’s even harder to plan, deliver and scale campaigns abroad.

By following the lessons in this article you will be able to effectively scale your app install campaigns more securely and with a lot less hassle. It’s based on the lessons we’ve learned at working on apps for clients across the world.

Are you ready to scale your UA campaign? Then let’s get started…


1. Be Sure Scaling Can Work

Frankly, if you can’t make campaigns profitable in you home country (which you know the best), it won’t be easier elsewhere. This is especially true in overcrowded verticals like news, anti-virus software, casual games and many others.

If there are hundreds of competitors in your market, and you don’t have any REAL competitive advantage, you need a reality check. Also, if your user Lifetime Value (LTV) for the previous 12 months is smaller than the average acquisition cost, then now may not be the right time to plan expansion.

It’s also worth re-considering your expansion plans if you’re not profitable (or don’t know if you are). If you are still optimizing campaigns for CPI and not sure of their performance, then you should use an attribution provider to record the real number of installs – and the revenue generated – from paid acquisition. Facebook Analytics, iTunes Connect, Google Play Console, Google Analytics or Firebase are just not good enough, and won’t give you the full picture of your traffic and profitability.

Before you commit to a scaling strategy, ask yourself the following questions:

Questions to ask before scaling UA

2. Choose Your Markets Wisely

Once you have clear figures of your average CPI and basic Return On Ad Spend (ROAS), you should then be able to generate a Lifetime Value (LTV) calculation for your app, and define a target ROI. 

The simplest way to choose your market is by selecting the best LTV by country (how much is the average user worth in US compared to France, for example?) and adding some additional data.

If you don’t have a country-specific LTV you can take the blended LTV from all sources – your total income for certain period – the previous month for example, and divide it by number of total users who used your app in the same period.

You will also need to estimate the downloads and revenues in your app category, or for your direct competitors. By doing so you will find a ‘purchase ratio’, which will tell you not only which markets are the biggest in terms of downloads, but also where users won’t spend a dime. You will also get an insight into the maximum acquisition costs, and in which countries you’ll be able to generate cheap installs for your soft-launch.

You can get this information from AppAnnie, Prioridata, Apptopia — or other mobile data analytics platforms — but it’s often faster, and more reliable to do your own tests to generate real data. Some attribution providers already have cost data at scale so you’ll be able to see the data in your attribution dashboard.

What’s next? You might choose to explore the general market situation in your potential target territories. Here, GDP absolute values/growth, or indicators like the World Happiness Index can tell you more. If you want to save some money you can use certain tools to help you understand how the general public thinks and feels about the subject matter of your app.

If, for example, I was promoting a fin-tech app, I would want to know how many people use their smartphone for banking, or how many people make purchases online. Information like this can be found in the Google Customer Barometer.

It’s important that you define your priorities. Will you go to a country with bigger potential audience, but higher CPI? Or do you see a chance to generate bigger revenues? Will you prefer a country with high GDP growth and so users are willing to spend more money? It’s up to you, but solid planning is the basis for a solid campaign.

3. Calculate Revenue Per Country

At this stage, you should have a clear list of countries you want to target. It’s time to roll-up your sleeves and use Facebook data to forecast your future revenues. Because we’re all interested in how much we can make, aren’t we?

Currently, only Facebook shares information about the potential reachable audience for each country. If you use Look-A-Like (LAL) audience targeting (I bet you do), Facebook will give you potential reach of an audience similar to yours. You can use whatever percentage look-a-like you see fit (3-5% from events which correlate highly with the purchase seem reasonable) to see how many users FB offers you.

You may think: ‘Hundreds of thousands of potential users? That sounds good!’ But there is a catch!

Usually only 25% – 30% of this audience is actually reachable. People are out, they don’t use Facebook everyday, or they might be just too expensive to reach with your bidding strategy. It’s safe to assume that your potential LAL audience will be similar in install conversion and CTR (at least at the beginning) as your initial calculations.

This equation can tell you how many users you might attract to your app:

This is the maximum number of potential users for one day. If you multiply by 30 you can get a reasonably good monthly average. In this case, that’s 157,000 users (but it will only happen if you are lucky, have a good creative and of course, the budget to pay for it).

What about other networks? For many clients, we were able to reach a similar number of users through AdWords UAC. While there are definitely some overlaps, you can roughly double the figure you have to obtain a reasonably accurate country potential for both major ad-networks.

Now, when you’re asked about how many users you can get, you can also extrapolate the cost and ask your boss for a budget. It’s rough calculation, but at least you have an idea of what it might cost to attract users.


4. Estimate Your Creative Team’s Workload

At this point, everything may seem to be going well and your budget has been assigned, but there are still some things to check-off, like preparing ad creatives and making some decisions about localization.

There are two useful mechanisms that can help you: A-B-T and Banner Frequency Fatigue:


A-B-T (Always Be Testing)

Even if I’m working on the smallest campaigns, with a budget of just a few hundred dollars, I seek at least two different creatives. It’s important to have variation because there will always be a difference between the performance of ad-groups, and you’ll learn something (even if you just use stock photos).

As a rule, you should run with at least two variations of your creative. Once you have these, you can use them as a basis to develop further iterations of your preferred direction. It’s worth having a pool of different ad creatives which you can use across networks, developing new ideas as you observe your CTR changing.


Banner frequency fatigue

Research has found that user fatigue with banners grows in relation to the the frequency that they are seen. Basically, the more people see your banners, the less influential they are.

Our experience at AppAgent correlates with these findings, demonstrating that the frequency of exposure influences CPC, and causes CTR to decrease. We avoid a frequency that exceeds 2.5, and at this point another creative must be made.

Based on your budgets and creative department availability, your number may be different – from 2 to 4. Be aware that anything over 4 could be deadly in terms of CPC increase.

This equation should help you calculate how many creative directions you may need:

If you are targeting more territories, you will need to localize, taking into account both language and cultural connotations.

If you are on a tight budget you could try to make use of Facebook’s dynamic language optimization, where you can add multiple translations to one creative. This will only work if you avoid text in your visuals or videos.


5. Prepare your Stores and app for a siege

You know the drill, it’s good to clean your house before your guests arrive. This applies to app stores too. If you are going to have multiple language ad versions, you will surely want to have app screenshots in multiple languages as well right?

Here’s a handy app store campaign preparation cleaning-list:

  • Adjust your screenshots and content to match your creatives (if you are communicating benefit A in the ad, it’s good that it’s also captured in screenshots)
  • Translate your screenshots to corresponding language versions (at least titles would be nice and translation is super-easy with services like fiverr)
  • Do you have any ongoing promotion? Put it at the top of the long-desc on Google Play or in the promotional text which will appear on top of your description in the iOS App Store.
  • Ensure your old screenshots still fit (if they don’t, fix it!). Got the shiniest app version in the screenshots? Screens for iPhone X? Important things are legible even on search results page?
  • Are your [deferred] deep links prepared? (If not, fix it too!). When using deep links, wouldn’t it be nice for your user to see some welcome screen connected to your ad as an in-app message?


Summary

There is plenty of information that can help you scale campaigns, but the key learning point is that if you’re considering international expansion it needs to be planned strategically. You simply can’t be led by your gut feelings. Data from one platform is usually not enough to make a decisive decision and following your instincts could be disastrous.

Sometimes, you and your product might not be ready for an expansion. So be realistic.

Before you make any decisions, acquire as much data as you can to help you identify the best countries to invest in and what sort of budget you will need to fund this expansion. You’ll then need to prepare your creative department for an incoming chunk of work – both on the add creative and in updating your App stores. Once this is done, you’re ready to go.

International expansion is never easy, but with planning and strategy it can be effective. Do the research and the work and you won’t need to play to a user acquisition god, because you’ll already know it’s going to work.

Happy scaling!

The post How to Scale UA Campaigns for Your App Growth appeared first on AppsFlyer.


Introducing OpenGDPR: The Unified, Open Protocol for GDPR

$
0
0

The new Global Data Protection Regulation (GDPR) takes effect in just a few weeks, introducing new data privacy rights for end-users. This regulation states that brands (which under the GPDR are considered controllers of personal data) will need to address user requests for access, portability, and erasure of their data within the required one month timeframe –or risk significant fines.

With the GDPR’s compliance deadline looming, companies could soon be faced with thousands–or even millions–of these user requests. In turn, each request requires that brands/controllers take action across the many systems and providers that process and store their user or customer’s personal data.


Better Together

At AppsFlyer, we understand the complexities of managing user data across marketing technology providers, and with the added GDPR requirements, this will become even more challenging.

To this end, we have partnered with other leading providers; mParticle, Braze and Amplitude, to develop OpenGDPR, the standardized, open protocol that establishes a common framework for GDPR data subject rights compliance. For marketers and developers, OpenGDPR will make data subject request management a more efficient and reliable process due to the increased interoperability across their technology stack. For technology companies and data service providers, OpenGDPR helps streamline controller requests with minimal custom development efforts.

OpenGDPR provides a common specification for marketers and their technology partners to communicate and manage GDPR requests around data subject rights, including but not limited to data access, portability, and erasure. By providing a common framework for scaling GDPR requests across the industry, OpenGDPR will help marketers and businesses continue to scale and grow in a responsible manner.


This is Only the Beginning

OpenGDPR will continue to bring industry-wide standards and best practices to the market over the course of 2018 and beyond. It is our hope that by using a shared, open standard, we can simplify the efforts required to adhere to these new regulations.

Join the movement and help keep our industry growing, legally compliant and respectful of user privacy rights.

Learn more at OpenGDPR.org or contact gdpr@appsflyer.com.

The post Introducing OpenGDPR: The Unified, Open Protocol for GDPR appeared first on AppsFlyer.

Step Up Your User Acquisition to Scale Up Your Fintech Mobile Business

$
0
0

According to the world bank, only 36% of adults in Indonesia have a bank account. That’s an astounding 113.7 million people who do not have access to bank services. This is why funding for fintech already exceeded eCommerce in 2016, and we saw a lot of Indonesian Fintech companies get 7- to 8-digit funding in 2017. We expect this trend to continue in 2018.

What’s happening now in Fintech in Indonesia is similar to what happened back in 2014 when the majority of funding went to eCommerce. Four years ago, eCommerce was just getting started. Currently, in Indonesia, Fintech is already one of the hottest (if not the hottest) industries in the country, and it is only the beginning.

We are already seeing startups in the fields of lending, payment, point of sales, crowdsourcing, accounting, and even cryptocurrency.

After chatting with several Fintech startups in Indonesia, I discovered that most of them are still new, small, very ambitious, and in process of scaling their mobile marketing efforts. Based on my experience, scaling mobile app user acquisition is a bit tricky and full of challenges.

As a Fintech startup, one of the first and most important things I would recommend is to implement a reliable attribution tool. What does this mean for Fintech?

Most of the startups I spoke with already track in-app events like register, use wallet, submit a loan, etc. The list below shows you five things you can do with attribution to successfully scale your Fintech app, while growing a loyal user base.


1. Measure Every Channel You Have (Email, Website, Social Media, etc.)

Track everything. Do you have a “Download” call-to-action button on your website? Track how many users come from there. Do you have a Download button in your email’s footer? Track it. If you can add a tracking link, you can track it. This will benefit you in two ways:

  • You will see which channels, including media sources, deliver the best users so you can know where to strengthen your focus and budget.
  • You will be able to remove noise from your organic data (usually used as a benchmark for paid media performance) to see the performance of “real” organic users.


2. Measure Rich In-App Events on the Back-End

Tracking is very different for eCommerce, Travel and Fintech. With eCommerce or Travel you can easily track a purchase event. With Fintech, there is a verification process on the back-end which can sometimes take several business days. If you don’t track it, you can’t optimize your marketing campaign toward a revenue event, one of your most important in-app events. It’s super important to track events, including rich in-app events, in your back-end. Rich in-app events offer you a wealth of granular data about each event for more effective segmentation and retention. Server-to-server API is usually the the most effective solution.

3. Leverage Active Campaign Monitoring Tools

Like I mentioned earlier, the up-and-coming Fintech companies I spoke to were all still relatively small; each with only one to two people in marketing. These tiny performance marketing operations are running and monitoring campaigns, doing A/B testing, preparing weekly reports, and on and on and on. In short, they’re swamped.

What these overworked teams need is a tool that automates the monitoring of a campaign’s KPIs such as number of installs and CPI. A tool like this can also notify the team when something happens like a 15% increase of media source X’s CPI from the day before. This kind of alert is critical to adjusting budgets. It keeps you from missing any important changes and takes the pressure off so marketers can focus on other important tasks.

4. Omni-Channel Attribution

Many Fintech companies also have a strong web presence, and it’s not unusual to find their users in both mobile apps and on the Web. Users check deals or information from a website and then continue inside an app to purchase products or submit a loan. Therefore, it is crucial for a marketer to track all of a user’s touch points to gain a complete understanding of the user journey. To track and attribute users from web to mobile, you’ll want to include the Customer user ID.

To take things a bit further, you can send website events using Server-to-Server API from your attribution provider. Your attribution provider will populate the data in their dashboard. This will give you the true lifetime value (app + web) of your users in a single dashboard.


5. Don’t Be Afraid to Test Media Sources

Doing performance marketing with only one or two people in a team can be tough. But don’t let it hold you back from testing another media source. In fact, some media sources are really easy to run and track.

A good media source will provide you with site ID which is a unique ID for their publisher. You can then tell your account manager which site IDs to focus on. Check out our Indonesia Performance Index where we rank media sources based on their quality and quantity of Indonesian traffic.


The Fintech industry in Indonesia is still quite young, but it is moving at an incredible pace in an extremely competitive market. We think 2018 will be the year most Fintech startups will try to scale up. And if they follow these five fundamentals of mobile attribution, they should have no trouble reaching their targets.


The post Step Up Your User Acquisition to Scale Up Your Fintech Mobile Business appeared first on AppsFlyer.

Take Your Tracking Links to a Whole New Level

$
0
0

In a lifetime, brands create hundreds, thousands and sometimes millions of links. They’re everywhere — in emails, web pages, SMS, behind CTAs, social media posts and social sharing, spreadsheets, and user invites — online and offline.

Whether you’re a marketer, advertiser or social media manager, the value of links is clear. Behind every link is a potential paying customer; conversions that are instrumental to your company’s success. However, if your company is like many others, once a link is shared, it’s often completely forgotten and therefore poorly tracked and optimized. And there is no recourse for modifying, reassessing or recalling links once they’re shared, creating a real challenge and even a potential threat to your company.

That’s why today we are delighted to announce a brand new Link Management Solution that includes a fully overhauled OneLink and Custom Tracking Link flow, now live for all AppsFlyer customers. The new Link Management feature provides unprecedented link visibility and makes building, shortening, cloning, tracking, optimizing, and modifying your flows across your owned and earned media platforms easier than ever before.


One-Stop-Shop for Your Tracking Links and OneLink Deep Links


To start using this new feature, head over to the left menu in your AppsFlyer dashboard and click Link Management.

Click on Add Custom Tracking Link and you’ll be prompted to choose whether you’d like to create a multi-platform OneLink or a single platform tracking link.

Follow the wizard, name your link and choose the application or OneLink configuration for which you are creating the link. Select the channel for sharing (social, email, SMS, blog, user invites, and more) and the campaign structure will be filled in automatically. You can then choose to add custom parameters, brand your short link, set your deep linking preferences and redirections and even add fallback options.

When you’re done, click Generate Link and your tracking link is ready to go.


A Special Treat for Savvy Marketers

Ready to dive even deeper? The Advanced section allows you to easily customize your lookback window and assign the currency and cost value for every install.


Long, Short Links and Downloadable QR Codes in One Single Click

As marketers add more tracking and flow parameters, links keep getting longer. OneLink provides full length URLs, short links for when you share on social, email or SMS, and QR codes for your non-digital media.

Edit Your Flows or Settings, Duplicate and Delete Links on the Fly

Once you’ve created your link, it will be listed under Link Management along with all the other links created in your account. You can edit your link settings and flow, copy your link URL, duplicate your link, and review its history.

Best of all, when you edit your link’s settings, your live link will automatically be updated without needing to replace links you’ve already shared.

To learn more about OneLink, Link Management and our custom tracking links, contact your customer success manager or schedule your AppsFlyer demo today.

The post Take Your Tracking Links to a Whole New Level appeared first on AppsFlyer.

Three New Ways to Find Fraud Using Post-Install Data

$
0
0

Aberrant in-app engagement is one of the most important and frequently misunderstood mobile app install fraud signals. As an anti-fraud data scientist, my team looks at both pre-install information as well as post-install engagement insights to identify and block bots, device farms and non-human behavioral anomalies. However, smart marketers realize just how important it is to understand their fraud benchmarks and define their fraud terms with networks. Today, I would like to share three ways you can identify and address fraud using your post-install engagement data.

Please note that while marketers with Protect360 now have the events/installs rate in the Advanced Detection report, this metric is also available to all AppsFlyer customers in the Overview Dashboard. Not yet working with AppsFlyer? Just download your raw data reports to divide your installs by a specific in-app event count to built your events/installs rate KPI.

Scenario 1: The Overzealous Fraudster

Though mobile fraudsters are always getting smarter, post-install engagement is considerably harder to fake. Consider the data set below.

This fraudster’s traffic delivers extremely high-quality users. This is often too good to be true. While it is highly unlikely that 100% of their installs completed a tutorial, it is extremely unlikely that 95% of their installs also completed level one.

To validate this activity, we can compare this publisher with first-party traffic from a highly reputable media source. This publisher is outperforming a top source’s first-party traffic by 4x. This could be a bot script, a device farm, or possibly mislabeled incentivized traffic, but it is almost certainly fraud.

Scenario 2 – The Flat Funnel

Using the same approach, let’s consider a typical post-install user journey.

As you can see, the majority of users who have downloaded this shopping app will click on at least one item. However, only one-third of those users will add the item to their cart, and just over half of those users will continue to register for the shopping platform before completing a purchase.

Now let’s consider the publisher below.


When we compare this events/installs rate funnel with the publisher below, we can clearly see that something is off.

In this case, the fraudster looks to be limiting its in-app activity, trying to simulate good, but realistic engagement rates. However, with limited insight into this advertiser’s engagement patterns, the fraud clearly stands out. If your measurement partner is using an Open Source of insecure SDK, this could be an SDK spoofing bot. If you are using a more secure SDK, this is fraud is likely coming from a simulator or device farm.


Scenario 3 – The Limits of In-App Engagement

Many types of mobile fraud, including bots, rely on weak SDK authentication (security). Weak solutions such as inserting a “signature” into SDK calls can be compromised in minutes – simply record a few open source SDK calls, identify the signature, and insert it into your own bot SDK calls.

However, strong SDK hashing makes it very difficult for fraud bots to simulate many types of in-app events. Consider the publisher below.

In this extreme situation, the fraudulent bot managed to simulate a real click and install, but the bot was unable to simulate in-app events. This is a telltale sign of bot fraud, often SDK spoofing that has been limited by strong SDK encryption.


In this case, the fraudulent bot was able to successfully fire one in-app event, but not any others. This heavily lopsided engagement is almost always indicative of non-human traffic.


Sometimes, a fraudulent publisher will mix in some “real” traffic to try to hide their mostly bot-driven activity. In the example above, Publisher 1 shows a lopsided post-install engagement pattern, but they aren’t quite at the zero events/installs rate. By benchmarking their performance against the app’s average performance trend, or a trusted media source, we can clearly see that this traffic is indeed, highly suspicious.


What You Should Do

Here are my five tips for marketers:

  1. Set clear fraud terms with all of your media sources. This will help avoid lengthy reconciliation negotiations down the line.
  2. Pay attention to your in-app engagement patterns and raw data reports using the methods outlined in this post. If you see something suspicious, bring it up with your attribution provider and media source partners.
  3. Stick with secure SDK providers. One-off solutions like signatures are easily compromised and require that you keep your SDK integration updated each time you are breached.
  4. Keep your measurement SDKs up-to-date to ensure that you have the latest security measures applied.
  5. When selecting a fraud provider, look for someone with deep knowledge of the mobile industry, a broad mobile data set and the ability to block fraud in real-time.

The post Three New Ways to Find Fraud Using Post-Install Data appeared first on AppsFlyer.

GDPR Request API: Streamlining Data Subject Requests for GDPR Compliance

$
0
0

The European Union’s General Data Protection Regulation is taking effect in just a few weeks. Over the last year, we’ve been working hard — collecting input from clients around the world, implementing rigorous technical measures and working with leading third party consultants to provide diligent GDPR compliance across our solutions and teams.

As a trusted business built on data, data privacy and security have always been at our core. Now, the GDPR has raised the bar even higher.  

As part of our commitment to data protection, we recently rolled out a set of new privacy and security features; launched new, robust and secure iOS and Android SDKs, provided SDK opt-in/opt-out and encryption options, and even introduced OpenGDPR; all with the aim of helping our customers build a connected and compliant digital marketing stack.

Today, we are excited to launch our GDPR Request API. This new API will provide account admins with a powerful and efficient tool to fulfill data subjects’ GDPR requests with minimal development efforts. The GDPR request API will help you programatically address the following user requests:

  • Right to Access: Provides a copy of the processed personal data to the data subject.

  • Right to Erasure (aka the right to be forgotten): Permanently deletes all personal data associated with the data subject.

  • Right to Rectification: Deletes outdated/incorrect personal data and updates data where applicable.

  • Right to Portability: Provides a copy of processed personal data in a structured, machine-readable CSV format.


Streamlining GDPR Data Subjects’ Requests Processes

Under Article 12.3 of the GDPR, data controllers must respond without undue delay, and have up to 30 days to respond to data subject requests. Accordingly, AppsFlyer GDPR Request API works as follows:

  1. When a data subject request is submitted through the AppsFlyer GDPR Request API, our system first queues the request for 48 hours (in pending mode). By queuing the request, we provide data controllers with the ability to cancel or modify requests (within the 48-hour time frame). Remember, once a request such as data erasure is processed and fulfilled, it is irreversible and can impact your raw data reporting and attribution data.
  2. After 48 hours, AppsFlyer will start processing the request. At this stage, requests cannot be cancelled anymore. The API can be queried on demand to check the status of any request by specifying the “subject request  ID”.

    When queried, the API will return one of the following responses:

    1. Pending: A correct request has been received and is currently in queue (first 48 hours)
    2. In_progress: The request is currently being acted on
    3. Completed: The request has been fulfilled
    4. Cancelled: The request has been cancelled

  3. When requests are fulfilled, the API will return a confirmation postback. All request logs are available for account admins in the AppsFlyer dashboard under GDPR Request Logs. This includes CSV files with the user’s personal data which can be downloaded where applicable.

GDPR Request API: Start Integrating and Testing Today!


As the GDPR deadline looms, now’s the time to get your company ready. When the GDPR begins to be enforced, you could be faced with thousands, or even millions, of these user requests.

To help you prepare, we have built and implemented a stub (test) API so you can begin integrating our API and testing it out right away.

The stub API has the same capabilities as our GDPR Request API and will improve your ability to QA your API setup with faster, more reliable tests. However, unlike the live API, the stub API sends automated postbacks in real-time: ‘pending’, ‘in_progress’, ‘completed’ postbacks will be sent at 30 seconds intervals.

The GDPR requires that both AppsFlyer, as a data processor, and you, as a data controller, fulfill the requirements of the GDPR. As such, we strongly recommend that all marketers and developers start integrating and testing the AppsFlyer GDPR Request API today.

To learn more about AppsFlyer GDPR Request API, click here or contact your AppsFlyer success manager.

The post GDPR Request API: Streamlining Data Subject Requests for GDPR Compliance appeared first on AppsFlyer.

The Latest from Vegas: Looking Back at MAU 2018

$
0
0

As Spring arrived in Las Vegas last month, nearly 2,000 mobile and app industry leaders from over 20 countries around the world converged at the MGM Grand for Grow.co’s annual Mobile Apps Unlocked (MAU). What began in 2014 as an intrepid meeting of 240 app professionals has truly become a global gathering of some of the most innovative minds in the business.

Once again MAU Vegas demonstrated that there is no other industry so fueled by the innovation and power in numbers, as the app economy continues to grow worldwide.

AppsFlyer welcomed a powerful number of the world’s leading app professionals to MAU in Las Vegas.

With a focus on the people, places, and trends shaping the world of mobile apps, MAU provided three days of insightful content sessions, as well as countless opportunities to share knowledge and meet like-minded individuals and organizations in a lively environment for collaboration, learning and fostering new relationships.

Whether in the main conference hall, the more intimate breakout sessions, the exhibition center, at poolside cabanas, or the parties in the penthouse suites or clubs, MAU was a celebration where thought leaders and experts from across all sectors and industries came together to discuss the myriad topics presented by the always-evolving mobile landscape — and how modern mobile marketing technology and strategies are helping businesses win in today’s app economy.

Data-driven thinking, content and contextual messaging, AI and chatbots, automation, cryptocurrency, ad fraud, privacy and personalization, performance branding, customer journeys and the marriage between product and marketing were only some of the items on the agenda.

*****

On Day One, AppsFlyer’s Sunil Bhagwan took the main stage with Fortune #1 company (and AppsFlyer client) Walmart as well as Sam’s Club for a panel discussion on how legacy powerhouse businesses are creating their enterprise-grade mobile growth stacks. For marketers, product and technical professionals, the session covered best practices and examples for building a platinum tech stack, and how to implement a scalable data infrastructure that grows an app business.

Austin Hay, representing Walmart, said that having a great tech stack is fundamental to moving fast and being successful, even for enterprises.

“At the enterprise level, you’re optimizing for flexibility, speed and agility — the capacity for a marketer and a product manager to execute quickly without needing additional engineering resources or having multiple conversations. It mainly comes down to instrumentation across your platforms for customer data, attribution, engagement and retention, as well as product analytics. A lot of people disqualify or don’t think about the need to unify your tools around these core data elements…but having unified tools allows you to quickly act and prevents you from getting stuck.”

“One recurring theme [when looking at building your mobile tech stack] is that you really want to surround yourself with the vendors and tools that are going to work for you — not only the ability to execute on the technology, but physically surrounding yourself with people who are going to treat you and your team as an extension of themselves. At Walmart we’ve built a growth squad around the toolsets we have, and we include representatives from those platforms not only when we have a question or demand, but as part of our strategy, our omnichannel goals, our overall growth,” said Hay.

“There are a lot of tools in the market…our team of 50-60 employees all need something different — so how do you coalesce around an idea or a tool that can help achieve multiple goals,” added Drew Frost of Sam’s Club.

Hay continued: “Part of the ideal framework for enterprise tech stack involves tying data sources together and thinking about cross-brand opportunities. You can imagine a world where we’re using our geo-services and our AppsFlyer attribution data in order to measure installs that are occurring in stores — and then we can house all that data in a customer data platform, send it over to Drew so he can run a marketing campaign for Sam’s Club. This type of full-funnel cycle, combined with the ability to send it over to different brands is the type of flexibility and power you need in a massive company. Anything is possible with data — the question for us is, is it possible to do something quickly and without a team of 50 people?”

“There is more power in the people you have. So despite us being Walmart and Sam’s Club, having those [external technology experts] from the tools we’re using to teach, train, coach and guide that strategy along is a very different mindset. We don’t think of our vendors as people we call only when there are problems, we actively engage those folks as part of our process — which helps us do better on our strategy. We look to work with those that want to take part in a bigger story than themselves as a vendor.”

*****

As usual, Adam Lovallo and the folks at Grow.co put on an awesome event.

“It’s amazing to see the continued growth, interest and investment in the mobile ecosystem worldwide — and I’m honored to see that manifest in the sheer number of leading players from across the industry who gathered at MAU in Vegas this year,” said Lovallo. “It’s always exciting to join forces with the innovators who are shaping the future of the app economy, and I look forward to what’s next for mobile marketers.”

*****

We can’t wait for next year. Hope we’ll see you there! 

The post The Latest from Vegas: Looking Back at MAU 2018 appeared first on AppsFlyer.

AppsFlyer and Google Partner to Bring New Transparency To View-Through Attribution

$
0
0

As the mobile industry has evolved, we have learned how to best make sense of countless signals from uninstall data to automated postbacks and mobile audiences. Over the last couple of years, marketers have adopted new mobile attribution techniques to better understand and improve their customer journey and bottom line impact.

After months of close collaboration with our partners at Google, we are excited to announce that you will soon be able to measure, attribute and customize both your click-based and view-through Google AdWords campaigns with AppsFlyer.

Leading up to this update, we have enhanced our reporting dashboards, segmenting performance data by view-through and click-based attribution. By measuring the impact of ad impressions across the customer journey, in AppsFlyer’s detailed reporting and dashboards, marketers can better optimize performance, and customize their attribution to meet business needs.

Running Google AdWords campaigns? As soon as view-through attribution is released, you will see a notification in the dashboard that will allow you to enable view-through attribution to all of your apps.

The post AppsFlyer and Google Partner to Bring New Transparency To View-Through Attribution appeared first on AppsFlyer.


New Study Reveals Key Targeting Parameter Benchmarks for High-End Devices in 36 Markets

$
0
0

Looking for high-value users? Pass this targeting idea on to the team. We’ve pulled some interesting data on the share of high-end devices in different countries around the world.

In 2018, app marketers are focused on quality to drive success for their apps. User acquisition has shifted from volume-driven to value-driven. One way to drive value is to target by device type, while specifically selecting high-end devices.   

Why target high-end devices? There are two primary reasons.

1) High-end devices drive increased spend: In general, it is safe to assume that high-end devices are owned by users with greater spending power. After all, their devices are expensive.

It is a well-documented fact that iOS users significantly outspend Android users when it comes to in-app purchases. And since the average iOS device is much more expensive than the average Android device, a correlation can be made between device type and purchasing power.  

2) Tech-savvy users drive increased spend: People who own the latest and greatest mobile devices tend to be more tech savvy; that is to say, in general, they are early adopters of all things tech. These users are often very comfortable within their app environments, which in turn translates into increased in-app purchasing.

What was the scope of our study in terms of devices, countries and app categories?

We looked at 19 types of iOS and Android devices (the priciest smartphones in the market – see list at the end of this post) in 36 countries around the world across 28 categories.

First, let’s explore the percentage of high-end devices in the top 20 markets. The graph below shows that the percentage of high-end devices tends to be greater in developed countries and lower in countries that are either underdeveloped or have relatively weaker economies. You might have already considered this in your strategy based on a fairly logical assumption. But now you have the numbers to back it up, and the knowledge, within each group, where there is a higher share of high-end devices.

This next graph illustrates the percentage of high-end devices broken down by OS.

We can see that with the exception of the Australia and UK markets, iOS clearly dominates Android by large margins. After all, the number of iOS devices is limited in comparison to the vast fragmentation of Android devices. But this doesn’t mean that you should target your efforts only for iOS. When it comes to pure scale, Android beats iOS by a long shot. Because of Android’s scale, even with a much lower percentage of high-end devices, we still see a lot of devices, as illustrated in the graph below:

Overall, there are 20% more high-end iPhones (models X, 8, and 7 including the Plus versions) than 10 high-end Android devices combined.

The US is clearly a superpower of high-end devices with both a high percentage and a large population. In fact, it has 5x more high end devices than the second highest country.

In Japan, Android is practically non-existent, while its share of high-end iPhones is off the charts. Why the lopsidedness? In 1999, Docomo, the Japanese mega mobile carrier, invented i-mode, the first internet-connected mobile device. Other carriers, KDDI and Softbank, then released a similar device.

When the iPhone was released in Japan, Japanese device makers like Fujitsu, NEC, Toshiba, etc. didn’t think it would hit big in Japan because they were over-confident about their i-mode devices. This is why they didn’t try to make an Android device. The first Android device was only released in Japan in 2010!

In neighbouring South Korea, the percentage of high-end devices is particularly high — across both Android and iOS — second only to the US. The main reason for this is that the government actually subsidizes the cost of smartphones and also intervenes in phone pricing and plans. As a result, high-end smartphones are far more affordable to the average user and therefore the “expensive device = increased spend” equation loses some ground.


Category breakdown

Different app categories have different percentages of high-end devices in different countries. That much is clear. How does gaming in the UK fare? What about shopping in the US?

To see ALL the numbers of 36 countries and 28 app categories, we created a matrix view where you can get all the data relevant to your category and country.


How to target high-end devices

Now that we know why and in which country and category to target high-end devices, let’s focus on the how. Basically, targeting these devices in campaigns includes the following options:

1) Selecting specific devices directly in the dashboards of several top media companies including Facebook, Twitter, Snap, Yahoo, and MoPub.

2) Running campaigns with other networks and informing them to target based on-screen density DPI or density per square inch (a strong indicator of a high-end device). This data is included in the bid request which enables the network to target by DPI, and it is particularly critical on Android where you need to separate the high-end devices from the numerous other devices.

3) Acquiring lists of device IDs of high-end devices from a DMP, and then uploading these lists to practically any media partner or exchange to run targeted campaigns.

4) When cross-promoting between a company’s different apps where it would use its internal DMP and then channel all the device ID lists through either an audience partner or the attribution provider.

5) Using lists of your existing high-end devices in your retargeting campaigns for effective re-engagement, and in your look-alike targeting campaigns to acquire similar high value users.


Key takeaways

  • Targeting for quality is key, so test it!
  • The US is the high-end device superpower; targeting for high-end devices in Japan and Korea can deliver significant value. But remember, localization in these countries can be challenging and requires careful planning and execution.
  • Although the percentage of iOS high-end devices is higher because there are fewer device types, Android’s scale carries weight; so don’t neglect Android.
  • Remember to factor cost, but also bear in mind that high ROI is more closely correlated to high revenue than to lower cost.

How your app performs will always, in the long run, depend on successful user targeting based on the right data. We hope these insights on device-type around the globe will help enhance your targeting strategy and propel your app’s ROI in the right direction.


*Devices used in our study of high-end devices: 

iOS: iPhone X, iPhone 8 Plus, iPhone 8, iPhone 7, iPhone 7 Plus

Android: Samsung Galaxy S9, Samsung Galaxy S8 Plus, Samsung Galaxy Note 8, Huawei P20 Pro, Google Pixel 2, Google Pixel 2XL, Oneplus 5T, LG V30, HTC U 11+, Razer Phone

The post New Study Reveals Key Targeting Parameter Benchmarks for High-End Devices in 36 Markets appeared first on AppsFlyer.

New Data Shows Uninstalls Remain A Significant Pain for Apps

$
0
0
app uninstall benchmarks

As competitive as the app marketing space is, it is no wonder that apps are extremely challenged with retaining their users. With too many competitors to count, and increasingly high user expectations, an app that does not deliver on all fronts, and fast, simply won’t be used. Even worse, it will be uninstalled…

Removing an app from a device is quite an aggressive move, clearly indicating that something is wrong. Understanding why, when and which users uninstall apps is extremely important in the fight against churn. In a freemium dominated space, securing ongoing usage is absolutely vital to success. Without it monetization becomes all but impossible.

More and more apps are recognizing this reality. In fact, since releasing our uninstall tracking feature in July 2016, we’ve seen a constant increase in the share of apps measuring this metric.

To help you understand how many users uninstall apps and compare your app to the competition, here are some updated benchmarks based on the following data sample:

  • 110 million installs
  • 1,000+ apps
  • Duration: April 2018

We isolated a cohort of users who downloaded apps (that have uninstall tracking set up) during the first ten days in April. We then counted how many of these users uninstalled the apps within 30 days to calculate the uninstall rate. 


Findings

What is the global uninstall rate?
The overall app uninstall rate after 30 days is 28%. That means that almost 3 out of 10 apps installed end up being uninstalled within 30 days of a download! Clearly, uninstalls are a major problem as users don’t think twice about deleting apps from their device.

What does the rate look like in different markets?

App uninstall rate by country

The data shows that, overall, developing countries have the highest uninstall rate while developed countries have the lowest. About 30% separates the first (Vietnam) and the last (the US). This is probably due to the fact that the average size of storage on a device in developing countries is smaller. More users in these regions have no other choice but to uninstall apps at a greater frequency in order to free up space.

How does the uninstall rate differ by category?

App uninstall rate by vertical

It appears that entertainment apps fall short when it comes to meeting user expectations. In this category, where streaming of video content is common, powerful infrastructure is required to ensure smooth sailing. When it doesn’t, and this still happens often, users get frustrated. Also, many entertainment apps need to regularly update content to keep users coming back for more. This requires significant resources and could also lead to abandonment when content is insufficient.

Travel apps have the second “best” uninstall rate. Because travel is seasonal and bookings rather rare, users often install an app, book their flight or hotel, and then uninstall the app at least until the next time they need to travel.

How long after downloading an app do users uninstall it?

App uninstall curve
The data shows that, as expected, the uninstall rate curve flattens over time. Clearly, the main problem is on day 1 and then also during week 1.


Taking Action 

Measure it! Clearly, uninstall is a significant problem and apps must measure their uninstall rate, understand exactly when, why and from which sources uninstallers came from to minimize it. Setting up uninstall tracking is quick so it is definitely worthwhile.

Remember first impression is everything. Because the uninstall rate is the highest on the first day, it is absolutely critical to nail the onboarding process. Make it seamless and engaging else you risk losing your acquired users at the blink of an eye. To reduce the uninstall rate between day 1 and 7, make sure your first interactions are designed to generate a strong, lasting connection with the user.

Deliver on what you promise. Overpromising in an attempt to get a download can backfire, leading to frustration and potentially damage your brand’s image in the eyes of the user beyond repair.

Inform your users about your app before download. Use video ads, playable ads if relevant, and a highly descriptive app store page which includes video/s and images users.

Keep your app top-of-mind. To prevent uninstalls, try to encourage ongoing engagement from the get go. Use all available channels – push, email, retargeting, social – to continuously keep the app top of mind. Make sure the user experience is optimal: do not overexpose your users, time re-engagement carefully, and make sure you have deep linking in place to deliver a seamless journey.

Don’t give up on uninstallers. We see many users re-install apps. That means you have a second chance to make a better, long-lasting impression. But remember this: getting users who deleted your app to use it again will take more than just a standard promotion. Offer them a significant discount or another high value incentive.

Define In-App KPI milestones to understand where users drop off. Understand the relationship between usage and in-app funnel progression (e.g. in gaming: tutorial completion, registration, level 5 success, level 10 success, in-app purchase. In e-commerce: category, product, add-to-cart, purchase). It is particularly important to know at which point an active user suddenly becomes inactive so you can encourage them to continue using your app by offering a special promotion, a discount, etc. And on an aggregated level, if you’re seeing a significant drop after a certain stage in your funnel, you probably need to change something in the app itself.

Listen to your users. Be part of any conversation about your app on social networks, app stores (through ratings and reviews), and communities. Make sure you tackle any negative feedback – both personally to the user in question and within the app itself – to learn from your mistakes and correct them.

Have a fantastic app! Although this is mainly aimed for product managers rather than marketers, the best way to reduce an app’s uninstall rate… is to have a truly great app. This may seem obvious but if your app does not deliver on all fronts then all the marketing data in the world won’t help.

The post New Data Shows Uninstalls Remain A Significant Pain for Apps appeared first on AppsFlyer.

CEO Blog Series: Are All Attribution Companies Unbiased and Independent As They Claim?

$
0
0
Unbiased Attribution

When we started AppsFlyer back in 2011, marketing and advertising was completely new to us. I got my first iPhone back in 2010 and very quickly realized that this device is going to ignite a radical change in our lives.

Then I noticed that app developers couldn’t measure where their users were coming from. It was (and still is) the new gold rush, where spray and pray was a legitimate ‘strategy’, especially since there was no technology that enabled mobile app marketers to measure their activities.

display luma scape

I still remember my reaction when I came across the display advertising LUMA slide (see image on right). What I saw was quite clearly a wild west of companies and I couldn’t understand the value each was providing. More importantly, I wasn’t clear on who was representing whose interests. I was convinced that measurement was a must, but I couldn’t really understand where and how it would fit in these different logo groupings.

I decided to start by focusing on one side of the market and build superior technology, product and service that would represent marketers. I believed that if we had a clear mission, without any internal conflicts of interest, we could gain a strong degree of trust that would allow us to have an open and transparent dialog with customers. I knew that this approach would allow us to deliver significant value to marketers and to the entire ecosystem.

Indeed, at AppsFlyer, ‘unbiased’ and ‘independent’ are not just words we push into our sales and marketing materials. They are a critical and core part of our company DNA. When we state that our mission is to make our clients successful, it is so, simply because we don’t have conflicting interests with any of our stakeholders.

Can you imagine buying real estate property without a lawyer to represent you and your interests? How about trusting the sellers’ word or their lawyers? Of course not! So why is it that self-proclaimed ‘unbiased’ attribution companies that measure billions of dollars of ad spend get away with it? I think the answer to that question is clear: a lack of knowledge and transparency in the market is to blame, and this is what this post aims to open up.

There are five fundamental points to understanding what it means to be unbiased and independent in the attribution business:

1. Playing both sides – Having both advertisers and publishers/ad-networks as clients

Some attribution providers have products that are separately sold to ad networks that represent a significant portion of their revenue. To make matters worse, some sell their clients’ data to anyone who wants to buy it. If you don’t know how your attribution provider makes money and who their clients are, there’s a good chance that you’re the product…

AppsFlyer statement: On Day 1, we chose a side and decided that the advertisers — and only the advertisers — are going to be our clients. We neither sell anything to ad networks, nor do we have any financial relationship with our integrated media partners whatsoever. As the Attribution Authority, this is especially crucial as we plan to further regulate the AppsFlyer ecosystem and remove fraudulent actors from our platform to protect our clients.

We believe that our transparent approach not only created trust with our clients, but also with our partners and the market at large. After all, ad networks don’t want to be discriminated by an attribution platform because they selected not to buy its products or services. They also don’t want to be pushed to buy services or products in order to get ‘special treatment’.

2. Selling data

There is no doubt that for most companies, data is their most important asset. Would you give a competitor your paying clients’ contact information? It sounds crazy, but this is the reality! Does your attribution ‘partner’ sell data for a living? Not a week goes by without an email landing in our inboxes from someone who is interested in buying (our clients’) data. This can be very tempting when you don’t have investors and you need to focus on revenue to finance your operations. It is precisely why we raised a significant round of funding to ensure that we are not tempted to do anything that might negatively affect our clients. Instead, we have the peace of mind to focus entirely on delivering value to our clients.

When your attribution ‘partner’ sells data, it puts everything your company does at risk. By doing so, they have a significant conflict of interest and it is possible that they are abusing your trust to create an unfair advantage by playing on both ends.

AppsFlyer statement: We do not and will not sell our clients’ data. Period.

3. Independent

Independent means we have the freedom to do what’s needed to make our clients successful without any conflicts of interest. Attribution providers cannot be independent when they sell media, services or products to ad networks.

AppsFlyer statement: We will continue to do whatever it takes to remain independent. We do not and will never sell data or media. We do not and will never sell products or services that can negatively impact our clients’ interests.

4. Investors and shareholders

In the last several years we have been approached by many investors. Some of them had an interest in market data or our clients’ data, while others were players in the media side of the business. Accepting them as investors could have endangered our unbiased positioning. It was therefore paramount for us to receive funding only from financial investors of the magnitude of Fidelity, Goldman Sachs and other top VCs. Our investors and board of directors are fully transparent and available to all to view.

Do you know who your attribution partner’s investors, shareholders and board of directors are? Do you really know what their long term interests are? Are you going to trust these vendors with your number one asset – your data?

AppsFlyer statement: We will continue to reject investors that can endanger our unbiased positioning in the market. In every decision we’ll make, we’ll continue to have our clients’ best interests in mind. We will never engage in any activity that could negatively impact our clients.

5. Can a biased attribution platform [truly] fight mobile ad fraud?

The answer is a resounding ‘No’. When an attribution provider has financial relationships with media companies, their anti-fraud offering is flawed. Their inherent conflict of interest simply does not go hand in hand with a genuine effort to truly clamp down on fraud rather than just talk about it. After all, do you really think that biased attribution providers would battle and even remove fraudsters who are also their paying customers from their platform? I don’t think so. Check out my previous post for more on this subject: How Market Leadership Can Solve the Fraud ‘Prisoner’s Dilemma’.

AppsFlyer statement: We will continue to invest heavily in our anti-fraud technology and reject any bad traffic that we encounter regardless of its source. We will also ensure that our media partners do the same. By taking action and raising the standards, we are committed to creating a sustainable win/win scenario for our clients, our integrated media partners, and the industry.

To sum up, selecting an attribution provider is one of the most important decisions for most companies. By selecting AppsFlyer as your attribution partner, you have the peace of mind that the company has successfully undergone a recent rigorous due diligence process led by Goldman Sachs, Fidelity and Deutsche Telekom. The process included a deep-dive into competitive analysis, product, tech, vision and last but not least mission. Indeed, we are on a mission to do whatever it takes to make our clients successful. It’s our DNA.

The post CEO Blog Series: Are All Attribution Companies Unbiased and Independent As They Claim? appeared first on AppsFlyer.

How to Attract Higher Value MCommerce Consumers Using Deep Linking

$
0
0

The benefit of apps to retail brands is undeniable. In general, and specifically for ecommerce, apps are well known to have significantly higher user loyalty and conversion rates than mobile websites. There are three main reasons: 1) apps tend to offer a more efficient and satisfying experience for users 2) brands can more easily communicate and connect with customers through instant updates and push notifications and 3) apps give users online and offline access.

Since loyalty and higher conversion rates are bottom line goals for any retail brand, let’s talk about how and why deep linking makes it much easier to attain both.  

Deep linking is the glue that connects the mobile universe together, fixing broken flows as users navigate between the mobile web and apps and between different apps. And it significantly improves the user experience; an absolute must to reduce churn. For more on deep linking, check out our comprehensive guide Everything a Marketer Needs to Know About Deep Linking.

The following use case, which we’ve seen a number of marketers implement, illustrates how you can use deep linking as a strategy to encourage more purchases and more downloads of your app. A brand’s overall long-term goal should be to convert mobile web users to app users.


In this first pair of screens we see an interstitial ad targeting users in the US for a sale on running shoes that leads shoppers directly to a page on a brand’s mobile website.

After the customer selects the type of shoe they want, they are brought to an “Add to Cart” page where they can choose color and size.

Behind the “Add to Cart” button is a deep link that enables two scenarios:

1) The user has the app installed: The deep link behind the CTA button collects the product information along with other standard attribution data and passes it to the app. The link also enables the app to seamlessly open at the right screen to complete the checkout process. Brands should always encourage their website users, whether they have the app or not, to complete their purchase inside the app. In general, conversion rates on apps are higher than on mobile web. And again, the fact that apps provide a better, faster user experience and build greater brand loyalty over time cannot be emphasized enough.


2) The user does not have the app installed: In this scenario, they can choose to download the app through the promotion button for an additional discount. They are then lead through the app store to download the app and straight to an identical “Checkout” page inside the app. This gives the customer a world class first impression and onboarding experience by opening the app exactly where they expect to. Meanwhile, the deep link passes information such as details of their product selection and attribution data back to the app. The user just taps on “Pay Now” and the purchase is made.

Deep linking should be a weapon of choice for any retail brand with an app. Your bottom line mcommerce onboarding strategy is simple: When customers come in through the Web, beam them straight into your app. Deep linking makes this happen, and the benefits are clear and easily quantifiable.

The post How to Attract Higher Value MCommerce Consumers Using Deep Linking appeared first on AppsFlyer.

GDPR: From Ambiguity to Innovation

$
0
0

On May 25th, the GDPR grace period ended, marking the culmination of over two years of prepping for the new European regulation. Companies have celebrated with cakes, and our email inboxes and social media feeds were awashed with dozens of updated privacy policies and hilarious memes. By now, no one has remained indifferent — the GDPR is real (and enforced), and the web will never be the same again.

credit: imgflip.com

The ambiguous design of the GDPR left a great deal open to interpretation. Legal, privacy, security and marketing teams from companies across every industry have had to pin down the right approaches for compliance ever since the regulation has been ratified two years ago. This is the impetus for the variations of privacy policy messages you’ve been receiving lately, along with emails from companies requesting consent to continue sending you newsletters and promotional materials.
 
To illustrate the different ways organizations have addressed the GDPR, we’ve assembled a selection of some of the marketing approaches taken by large companies.

Opt-in or Opt-out: That is the Question

Under the scope of the GDPR, data controllers (brands collecting data) shall:

  1. ”…be able to demonstrate that the data subject has consented to processing of his or her personal data.” (Article 7)
  2. “Provide the data subject the right to object to processing of personal data concerning that person. Including the right to object to direct marketing and profiling.” (Article 21)

Considering the two GDPR clauses above, what’s the right approach marketing teams could have taken to comply with the regulation? Provide an opt-in option (get consent), or opt-out option (address the right to object) to their newsletters and emails? Or maybe both?

Have a look at the below email sent by a major retail brand, first urging users to opt in, and then providing both opt-in and opt-out options. Whether the user is confused or not, this brand certainly wanted to leave nothing to chance.

While most of the companies have sent emails with opt-out options, some others, like this famous media company, have decided to take a hard line and provide an opt-in option only. This makes us wonder: what if most recipients have never acted on those emails? Were they all opted-out automatically?

A Catalyst for Innovation

That being said, GDPR compliance does not begin or end with newsletter opt-in/opt-out options and privacy policies. The complex nature of the GDPR led companies to take various paths to all aspects related to the regulation and, in doing so, fueled innovation and became a real catalyst for digital transformation.

We’ve seen companies going above and beyond, rolling out new and innovative solutions to comply with the GDPR — and some (disclaimer: like AppsFlyer) decided to band together to form a consortium to streamline the compliance process.

The public was, and still is thirsty for knowledge. Savvy companies quickly understood that the GDPR is a subject that should be leveraged and presented new opportunities. Those that have done so, have quickly reaped the fruits of their work and gained traction in their respective industries.

The most important thing to remember about the GDPR is that it’s not a one-off compliance effort. Rather, it’s a continuous journey that will certainly evolve over time, changing the nature of how companies and individuals interact with each other in the digital sphere. The bottom line is that the GDPR is here to stay, so companies should embrace the change and learn how to innovate, grow and adapt amid a new regulatory landscape.

The post GDPR: From Ambiguity to Innovation appeared first on AppsFlyer.

Viewing all 871 articles
Browse latest View live