Quantcast
Channel: AppsFlyer
Viewing all 869 articles
Browse latest View live

Pinterest Designates AppsFlyer as Marketing Partner for Mobile Measurement

$
0
0

Pinterest, which recently passed 150 million monthly active users and expanded their ad offering for mobile app marketers, has named AppsFlyer as a Pinterest Marketing Partner for Measurement. As a Pinterest Marketing Partner, AppsFlyer now provides marketers leveraging Promoted App Pins with end-to-end measurement for ROI optimization so they can maximize the performance of their campaigns. AppsFlyer has recently participated in early tests with more than 10 clients that showed high intent audiences and retention rates.

“U.S. marketers put Pinterest on par with Twitter, Instagram, Snapchat and LinkedIn when it comes effectively engaging consumers, said AppsFlyer’s VP Marketing, Ran Avrahamy. “Pinterest’s decision to partner with us reinforces the invaluable audience insights we provide to help mobile marketers grow and use paid, earned and owned mobile content.”

AppsFlyer’s full suite of solutions, which includes unbiased attribution, mobile campaign analytics, in-app user engagement tracking, ROI and lifetime value analysis and its Active Fraud Suite, will immediately enhance marketers’ campaigns and user acquisition efforts. To date, it has benefited 10,000 clients across a diverse range of verticals ranging from entertainment and lifestyle to gaming and travel.

“Third-party partners are an important part of our commitment to rigorous, high-quality measurement,” said Gunnard Johnson, Pinterest’s Head of Measurement Science and Insights. We’re excited to announce new measurement partners that will help advertisers see the value of Pinner intent and Pinterest’s unique content.”


7 Things You Need to Know About The App Market In Latin America

$
0
0

Have you ever imagined that the mobile industry would represent between 4% and 5% of the economy of Latin America today, while in the developed world, for example the Unites States and main European countries, mobile represents only 2% of the economy? In fact, according to eMarketer, Latam is one of the world’s largest mobile markets.

There were nearly 300 million mobile users in the region at the end of 2015 and it is estimated that the this number will reach 396 million in 2016, 252 million of which will own a smartphone.

It was only several years ago when limited data connections were the main obstacle for mobile growth in Latam. However, developments in infrastructure, the emergence of 4G technology and improved access to high-speed Internet have helped propel mobile penetration in the region.

As a result, there is also a significant growth in app downloads and app usage in Latin America according to new data from Business Insider. Therefore, Latam today represents a unique opportunity for developers and marketers looking to invest in a rapidly growing market.

Here’s what you need to know about Latin America’s app market:

1) Brazil and Mexico account for most mobile app sessions in Latin America, according to eMarketer, accounting for 55% of sessions in the 12 months between June 2015 and June 2016. However, small countries like the Dominican Republic and Bolivia scored some of the highest growth in terms of session activity, at 116% and 155% increases year-over-year, respectively.

2) About 20% of time spent on mobile was devoted to sports, and nearly 20% was devoted to messaging and social.

3) It’s unlikely that developers will be able to rely on the same app monetization methods they use in developed markets because there is a lack of credit cards in the region. For this reason, publishers should look into alternative methods of monetization, such as partnering with mobile network operators to allow users to pay for their apps via their monthly phone bill, mobile coupons or subscriptions.

4) Marketing automation software is not prevalent yet. Very few companies in Latin America use marketing software today, and only 3% of marketers listed automation as their top priority for software features. Instead, these marketers are more focused on other areas, such as content creation and SEO.

5) Both the CPI and CPA pricing models became much more competitive this year compared to last year. Earlier, with considerably lower costs, marketers got good results, but today prices have risen as technologies have become more complex. But by tracking post-install events (which show users’ behavior within mobile apps), we can better understand in-app user engagement.

6) Location-based retargeting in the region enables marketers to define specific places that users often visit. This allows for segmented mobile campaigns, and as such the delivery of a personalized ad to drive better engagement. It is a totally new concept in mobile retargeting in Latam.

7) Mexico & Argentina are the two best markets to invest in. Both countries have a significant volume of consumers in addition to moderate costs that allows for good results. Brazil has the most advanced market in Latin America (halfway between Europe or the United States), but the market is more competitive with many more players leading to higher average costs. However, it is still without a doubt the country that has to be part of any strategy in Latam.

eMarketer predicts that in 2016 Latam will represent $2.34 billion in mobile ad spend. This not only demonstrates that the Latin American market is fast growing, but also that it’s far from reaching its ceiling.

Are you ready to take advantage of the great opportunity entailed by mobile marketing in Latam?

7 Tips to Improve Your App Uninstall Rate

$
0
0

It’s tough out there. Today’s saturated app marketplace is creating lots of problems for marketers and developers, especially when it comes to usage (or rather lack of it)… But even worse than lack of usage is removing an app from one’s device. A high uninstall rate is a strong signal of discontent so it’s really important that you know when and why users uninstalled your app and make every effort to minimize that number. 

The following tips are a good place to start. They are part of our new App Uninstall Report which provides uninstall benchmarks by platform, category and country. It is the industry’s most comprehensive study on the subject to date, offering, for the first time, data on iOS uninstalls.

1) Utilize uninstall data to acquire intelligently: Dive deep into your UA data to understand which channels, media sources, campaigns, publishers, countries and creatives delivered loyal users and which delivered high uninstall rates – and shift budgets accordingly. Don’t forget to factor ROI in as low quality installs with high uninstall rates also have far lower price tags (but remember a high uninstall rate will also hurt your app’s ranking in the app store – so use moderately).

2) Re-engage across channels. The best tactic to prevent uninstalls is to ensure a user’s ongoing engagement from the get go. The key here is obviously a great product/app that meets the user’s expectations. But from a marketer’s perspective it means using all available channels – push, email, retargeting, social – to continuously keep the app top of mind and propel users to engage with your app rather than the dozens on their device and numerous others in the app stores. Each channel is important: 86% of emails are opened on a mobile device; a personalized push message doubles retention rates and reduces the likelihood of an uninstall by 15%; and retargeting is becoming a top priority for marketers.

Strong engagement is driven by many factors, with frequency and relevancy topping the list. Measure, test, and then do it again and again to pinpoint the ideal number of engagements per channel and across channels. Too much and you risk losing the user.

3) Define In-App KPI milestones to understand where users drop off. Understand the relationship between usage and in-app funnel progression (e.g. in gaming: tutorial completion, registration, level 5 success, level 10 success, in-app purchase. In e-commerce: category, product, add-to-cart, purchase). It is particularly important to know at which point an active user suddenly becomes inactive so you can encourage them to continue using your app by offering a special promotion, a discount, etc. And on an aggregated level, if you’re seeing a significant drop after a certain stage in your funnel, you probably need to change something in the app itself.

4) Measure rich in-app events to enhance relevancy: Granular measurement of in-app activities will help you understand what each user does in-app, add them to a specific segment and run highly targeted campaigns across email, push and / or retargeting with content that is relevant to the user’s segment and personalized based on the user’s actions. For example, rather than simply measuring add-to-cart events, you can measure add-to-cart events of users who viewed running shoes priced above $100. Armed with this knowledge you can re-engage with those users by using a specific offer for quality running shoes, or even a new Dri fit collection. To further enhance relevancy, show users the exact pair of shoes they added-to-cart. When the content speaks to the user, action often follows!

5) Offer real value to reactivate dormant users and uninstallers: Users need compelling value propositions to come back to an app they’ve stopped using or uninstalled. The best way to spark their interest and generate action is through discount offers and exclusive content. According to a Think With Google survey, 30% of users polled said they would be prompted to restart using apps not used or uninstalled if offered a discount or coupon for their next purchase, while 26% said exclusive content would do the trick.

6) Use video ads to find the right matches: Joint AppsFlyer-AppLovin research has shown that video ads are a proven method to acquire loyal users. That’s because a video ad can show so much more of what an app has to offer, and as such sets the right expectations. A video helps users better understand if the app in question is right for them or not. With insufficient information, users install an app only to realize that it was not what they had hoped for – and then the uninstall quickly follows. Don’t leave room for surprises!

7) Have a fantastic app! Although this is mainly aimed for product managers rather than marketers, the best way to reduce an app’s uninstall rate… is to have a truly great app. This may seem obvious but if your app does not deliver on all fronts then all the marketing data in the world won’t help. That means, first and foremost, performance (rapid loading, no crashes), a great UI/UX that makes everything simple and intuitive – especially while onboarding a new user, non-intrusive in-app ads that do not affect app performance, and delivering what the app promised to deliver!

For more valuable tips on how to reduce the number of uninstalls, in addition uninstall benchmarks by platform, category and country, download our free App Uninstall Report today!

View-Through Attribution: The Good, The Bad & The Ugly

$
0
0

View-through attribution in app marketing occurs when an ad impression served to a user is given credit for delivering an app install. This happens when the following conditions are both met:

  1. There is no click within the defined window (usually 7 days)
  2. The view occurred within its own defined window (usually 1 day)

In the following scenario, which network wins?

install-windows

The answer: Network B.

Network B had the last click within a lookback window, while a click wins over a view – even if the latter is within its window.

Just like the iconic western starring Clint Eastwood, there are several forces at play when it comes to view through attribution. 

The Good: Cross-Funnel Insights

Measuring the impact of ad views is an important piece of the mobile marketing puzzle. After all, the concept of view-through has been around since the dawn of advertising: A billboard, a newspaper ad, even a TV ad – when people see these ads and later buy from the brands that advertised, that’s view through attribution, which has represented the lion’s share of advertising since the industry’s inception.

Advertising in all shapes and forms does not happen in a vacuum, and we are all influenced by things we see and messages we hear. And since the number of people who view ads before installing an app is much higher than the number of those who click on ads, the importance of consumer views in the overall purchase cycle is clear.

Of course, measuring the impact of viewing an ad offline was only possible by correlating the in-store sales lift during campaigns. And when the web emerged, all of that changed (mostly for the good; more on the bad further ahead).

In mobile, the fact that views can be measured and attributed in app-install campaigns offers important insights into an app marketer’s funnel: when and which media sources touched the user, what role did views play in driving users down the funnel, how many app installs were impacted by views, and of course how many installs ended up being attributed to views.

Impressions also play an increasingly important role in app marketing because of the growing use of video advertising. Since videos are often viewed rather than clicked on, impression tracking and view-through attribution offers marketers performance insights into their video campaigns, which is quickly becoming a must-have channel for successful apps.

In addition, view-through attribution data is important for marketers in emerging markets where users often view ads but only install when they are connected to wifi.

The Bad: Viewability Standard and Billing Challenges

An important distinction should be made between ads served and ads viewed. After all, Minority Report-style view tracking is still not available to guarantee 100% viewability…

In the real world, how can advertisers be sure that their served ads were actually viewed? How do marketers know that the insights in the campaign reports are accurate, not to mention view-driven billing figures. This issue became a major concern on the web where pages often had multiple ads: on top, on the side, below, popping up etc. The web viewability standard was first introduced in 2004 by the IAB and MRC. In 2014, it was defined as having 50% or more of the ad’s pixels in-focus, in a browser tab, and on the viewable space of the browser page for at least one second post ad render. However, web viewability challenges remain because different ad units, browsers, ad placements, vendors, and measurement methodologies yield “wildly” different viewability numbers, according to the the IAB.

If the web is still grappling with a viewability standard, mobile is as well as it’s still the early days. The MRC, MMA and IAB issued mobile viewability standards in April this year which stated that, like desktop, an ad is viewed if 50% of its pixels were in view for one second for display ads and two seconds for video ads. Moat was the first to be accredited for mobile viewability, followed by Integral Ad Science.

Where does that leave us? For now, running with media partners that are integrated with accredited firms will alleviate most concerns about non-viewable impressions. However, it won’t be able to generate the scale and media diversification you need. The good news is that there are several hundred networks that are capable of measuring viewability on their own so it’s important to understand what constitutes a viewable ad for each of your media partners.

How does the attribution provider fit in here? It relies on impression (and click) data sent by the media partner. For example, if your video ad network reports views only after a video is completed, that’s the impression data an attribution provider will display and rely on for view-through attribution.

The bottom line is that you need to build a trusting relationship with your media partners. At the same time, you need to monitor your post install performance, the impact of views as assisted installs, etc. to ensure that views you are building performance models on and paying for are delivering real, measurable value. Constant monitoring is especially important when running with networks that cannot measure viewability.

The Ugly: Fraud

Fraud continues to taint mobile ad data. If you are running on CPM, it can be particularly painful as the IAB estimates invalid traffic costs mobile advertising $1.3 billion. Although most performance-driven app marketers who focus on user acquisition do not run CPM campaigns, there are exceptions as some mobile ad networks only offer CPM. Also, the red-hot mobile video ad format – with its high payouts – is primarily CPM-driven.

How are impressions typically faked? There are cases when fraudulent publishers stack multiple display ads on the same piece of real estate. The advertiser is then charged for multiple views even though the user was only exposed to one ad; or when seemingly legitimate apps actually “hijack” a user’s app — which then runs in the background, serving hundreds of ads at a rate as high as 20 ads per minute.

Since it is relatively easy to generate a fake impression (when compared by degree of difficulty to a click, an install, and an in-app event), fraudsters generate millions of views, hoping to claim organic installs as their own by manipulating the view-through attribution mechanism. According to a recent study we issued, total app install and in-app engagement fraud cost advertisers up to $350 million in 2016.

The most important thing to understand when it comes to fighting fraud is that prevention is key. The main prevention methods include:

  1. Active IP, user agent and device ID filtering.
  2. Distribution modelling to detect anomalies such as mean-time-to-install (MTTI).
  3. Device ranking which is a third critical layer of defense that fights fraud at the source – the device level.
  4. Install and in-app receipt validation to validate the legitimacy of an install or in-app purchase by connecting to the app store’s servers.

For a detailed description and other anti-fraud measures, download our guide: Mobile Ad Fraud – What You Need to Know.


To summarize, audience views have always played a key role in advertising. Understanding the impact of views on mobile app installs and post-install activity is another key piece of the puzzle app marketers need in order to drive success.  

Top 10 + 5 Mobile Marketing Stats from November

$
0
0
 
TOP 10 STATS
November 2016
 
Mobile marketing research you need to know about Click me
$1.2B
in revenue driven from mobile devices during Black Friday, up 33% YoY
FB
 
534%
increase in churn when app suffers crashes
sensortower
 
88%
is Android’s updated global market share – a new record
pubmatic
 
78%
of US game consumers play on their smartphone
unity
 
70%
of marketers said mobile retargeting is effective or very effective
kinetic
 
60%
mobile’s impression on-target rate, up from 49% in Q1 2015
juniper
 
43%
increase in Tencent’s net profit attributed to mobile ad growth
idc
 
33%
of marketers use multi-touch attribution tools
pwc
 
30%
of the top apps in the App Store use video in their page
Gartner
 
20% increase in time spent in apps from beginning of 2016
app annie
 
5 Honorable Mentions
 
183% increase in US proximity mobile payments to total $27.7 billion in 2016
 
91% share of global smartphone profits in Q3 2016 captured by Apple
 
88% of advertisers find in-feed video to be objective against their goals, vs. 63% for banners and 66% for rich media
 
84% of global airports are undertaking either a commercial deployment or a trial project related to proximity sensors.
 
65% find their place of travel through friends and family via Facebook


Customize Your Fraud Protection with Validation Rules & Protect360

$
0
0

When it comes to fraud protection, one size doesn’t always fit all. Larger apps and app downloads in developing markets often have longer than normal click-to-install times. Then there are the times you want to dial-up your fraud protection — such as when marketing in a region hit hard by fraud, or when facing questionable traffic from a very cost-effective media source.

With Validation Rules, you can now easily customize your Protect360 protection, delivering the optimal, automated protection for your business needs.

Protecting Against Install Hijacking
Install hijacking is one of the most common types of mobile fraud. In install hijacking, fraudsters insert malicious code into otherwise normal mobile apps. This code detects when an app is being installed and sends a false click report for that app (during the install process). This false click “hijacks” credit for the install.

The best way to find install hijacking is to identify short click-to-install time (CTIT) trends. It is simply impossible for a human to click an ad, load the app store, download and launch an app in under 5 seconds. This is the surest sign of install hijacking.

Protect360 already provides automated protection against install hijacking by blocking installs with short CTIT. Further customizing your install hijacking protection with Validation Rules takes only a few seconds.

  1. Open Validation Rules and create a new Protect360 ruleset.
  2. Select which media sources and campaigns you would like to protect.
  3. Select your fraud parameters and Geos.
  4. Save and Activate the rule.

It’s that easy! Attribution that doesn’t meet your fraud standards will now be automatically blocked.


For example, let’s say you have a large app and your Protect360 dashboard shows that your app typically takes at least 40 seconds to download. While other apps may be covered with a 5 second CTIT threshold, your app needs a different, longer minimum CTIT. With Validation Rules, you can easily define a longer CTIT across all media sources, automatically blocking all invalid traffic.

Running with an affiliate network for their low cost, but their performance looks too good to be true? Check out their performance in Protect360. If they have a shorter than normal CTIT, you can dial up your fraud protection by setting longer CTIT requirements for this particular network in Validation Rules.

Facing some troublesome traffic in the parts of Asia, the US, Canada and UK? Protect yourself by setting stricter (longer) CTIT parameters in affected regions.

With Validation Rules, you can increase your fraud protection for targeted media sources, campaigns and GEOs. All blocked installs and resulting savings will be reported in Protect360, and raw data logs can be downloaded in Protect360.

While all blocked installs are fully transparent to integrated partners, we recommend maintaining open and transparent communications with partners about changes in Validation Rules to avoid any confusion.

To learn more about Validation Rules and Protect360, please speak with your Success Manager or schedule your AppsFlyer demo today.

The post Customize Your Fraud Protection with Validation Rules & Protect360 appeared first on AppsFlyer.

Making Key Performance Indicators Work for You

$
0
0

Performance means different things to different companies. A company’s growth stage, business objectives and type of business will determine which types of data should be analyzed in order to answer one single question — how did app X perform?

Each mobile app is and should be judged by different success KPIs, helping the app marketer and management arrive at a true understanding of the specific audience.

That’s why today, AppsFlyer is releasing a fully overhauled Activity Dashboard with several new KPIs and trends arming you with all the data and insights you need to power your growth.


New Key Performance Indicators Now Available on AppsFlyer’s Activity Dashboard:


      1. App Stickiness: Daily Active Users (DAU) / Monthly Active Users (MAU)App stickiness is key for analyzing the frequency of of your users’ engagements.

        To calculate stickiness, we divide DAU by MAU and get a percentage rate. The higher your DAU/MAU rate, the more often your users engage with your app.

        Example: If all your users engage with your app every other day, your app is 50% sticky.

        To increase your app stickiness, think about what value you provide to keep your users coming back. In general, enhancing your user experience and optimizing content should increase your stickiness over time.

        click to enlarge


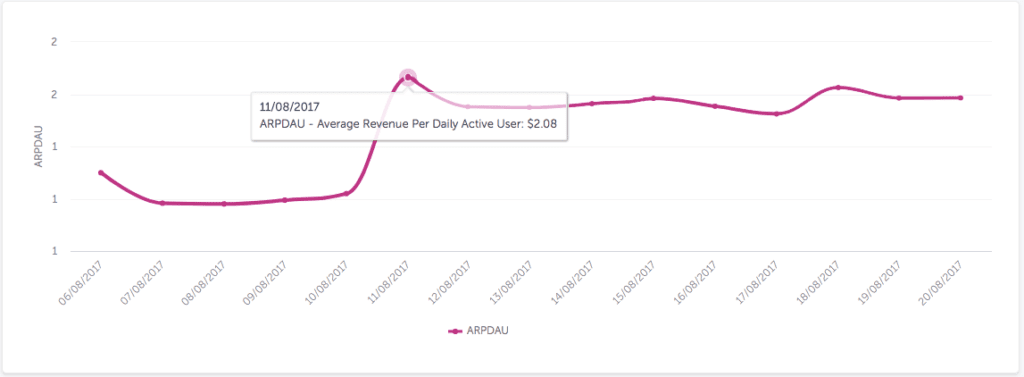
      2. Monetization Performance: ARPDAUAverage Revenue Per Daily Active User (ARPDAU) is key for tracking mobile app monetization performance. App marketers use ARPDAU to compare monetization performance over time.

        To calculate ARPDAU, we calculate the average user revenue within a selected time period and divide by the number of unique users cohorted (grouped) for that same time period.

        In gaming for example, ARPDAU can tell how well a new mobile game version release is performing where the goal is converting average daily players into revenue generators.

        click to enlarge


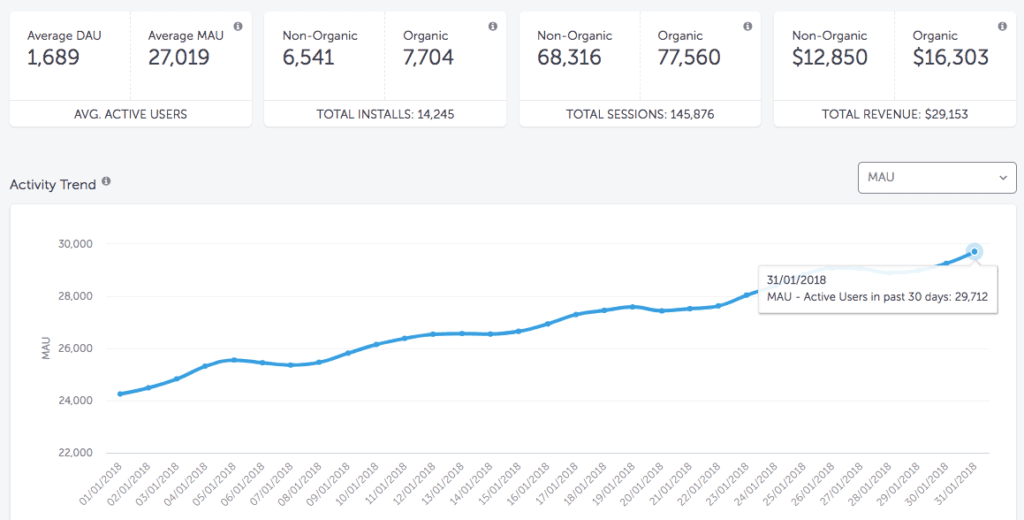
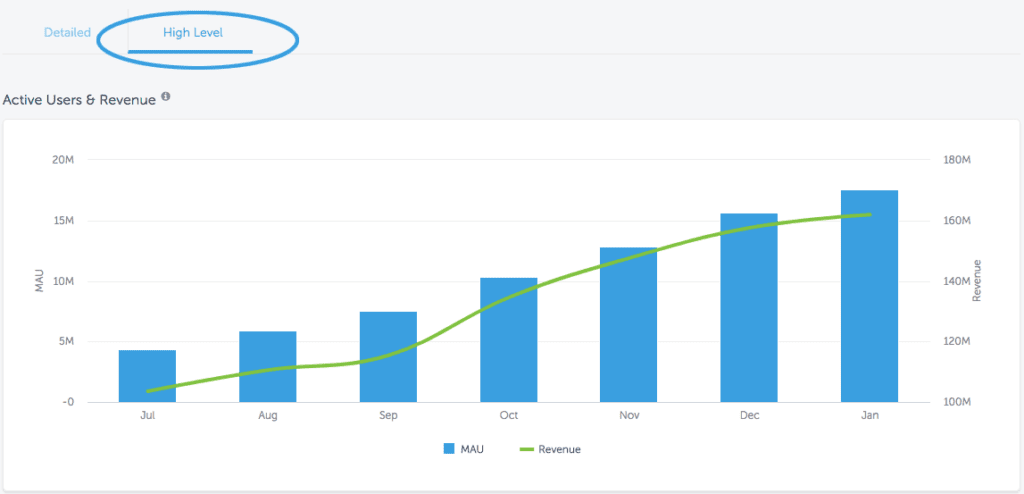
      3. Monthly Active Users: MAU

        Monthly Active Users (MAU) tells you the unique number of users who engaged with your app 30 days prior to a selected time frame. Placed side by side with DAU, MAU is a great app engagement metric for analyzing user engagement trends over time.

        Example: MAU rate on January 31st will tell you the number of unique users who have engaged with your app between January 1st and January 30th. In this example, a rise in the MAU rate indicates an improvement in app user-value or quality. 

        click to enlarge


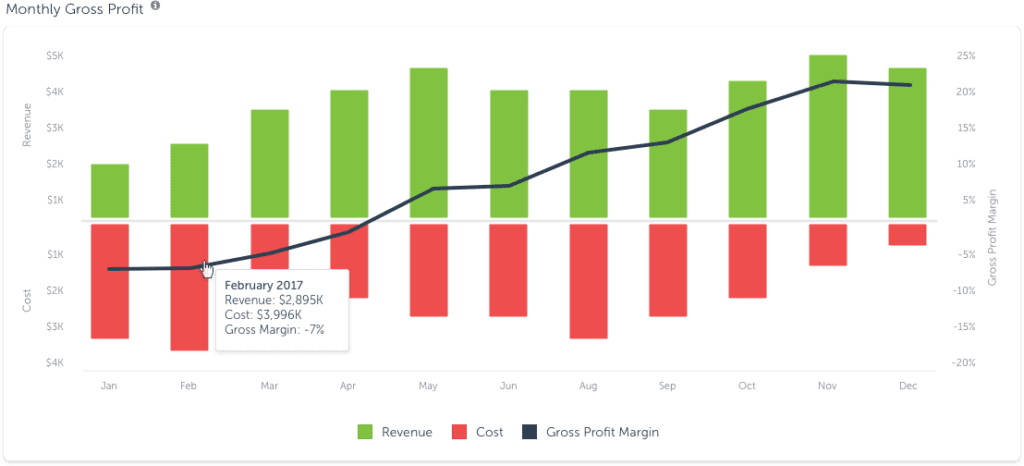
      4. Business Performance: Cost, Revenue and Gross Margin

        Whereas the ROI numbers on your Overview Dashboard are cohorted (grouped) by the install dates, cost and revenue on the Activity Dashboard show actual cost, revenue and profit that happened during a selected time period.

        This is very helpful when you want to pull data based on fiscal or calendar dates for creating business reports, QBRs (quarterly business reviews) etc.

        click to enlarge


Filter and Group by What Matters to You

The Activity Dashboard now allows you to filter and sort data by a number of available data points such as media source, geo and more. This allows faster insights into what really matters to you.

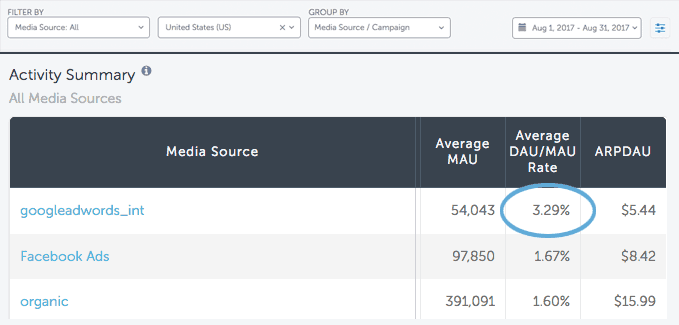
Example: Let’s say you’re interested in knowing which media source drove your most engaged users in the US over a specific time period. By using the geo-filter and selecting the US, you can look at all media sources that brought traffic from the US and have the highest DAU/MAU rate.

In this example, you can clearly see that Google Ads brought the most engaged users in the US for that specific time frame. Should this company wish to acquire more engaged users in the US in the future, Google Ads would be a great media source to invest in.

It’s important to remember that while LTV and other metrics on your Overview Dashboard represent a cohorted analysis by users’ install date; metrics on the Activity Dashboard aren’t cohorted and represent the actual data for the selected time period.


Insights That Work for Your Team

We know that teams have different needs for defining success.                                    Senior management looks at high-level data and business performance KPIs. In contrast, mobile app marketers and product managers want more granular data and daily insights on usage trends to optimize their performance.

With AppsFlyer’s new Activity Dashboard, you get the best of both worlds with both high-level trend data and detailed, granular insights.

click to enlarge

To really drive user growth and increase retention and monetization, you’ve got to have deep insights into your user’s behavior. AppsFlyer’s new Activity Dashboard will help you achieve that.

To learn more about AppsFlyer’s Activity Dashboard, speak with your AppsFlyer success manager or schedule a demo today.

The post Making Key Performance Indicators Work for You appeared first on AppsFlyer.

3 Ways Marketers Are Using Mobile Ad Revenue Attribution to Boost Their Performance

$
0
0

In-app advertising is a significant, and growing source of mobile revenues, particularly for mobile gaming, utility and deals apps. However, many marketers still struggle with both limited access to in-app ad revenue data, and how to best use this data once they have it. With the introduction of in-app ad revenue reporting for Facebook Audience Network, here are three powerful ways marketers are using in-app ad revenue data to boost their impact.

  1. Improve Your ROI-Based Performance
    Increasingly, marketers are optimizing their campaigns based on LTV and ROI KPIs. While ad revenue is a critical component of monetization, many UA teams have limited access or insight into the ad revenues generated by the campaigns.

    At AppsFlyer, ad revenue measurement is included at no additional cost across all pricing packages, and setup takes only a minute. This integrated ad revenue reporting provides timely insight into your total LTV and ROI, right in the dashboard you are already using.

    Over the second-half of 2017, marketers that optimized campaigns based on their ROI saw a 20% lift in their bottom-line marketing impact, while top brands saw a 3x ROI lift. With your newly expanded ad revenue reporting, measuring your LTV and ROI has never been easier.
    Facebook Audience Network ROI

  2. Improve Your LTV with Activity Reporting
    Your newly upgraded Activity reports provides powerful insights into your marketing, product and mobile business performance. As all data is cohorted by activity date rather than install date, Activity reports help businesses understand their app health and performance.

    By measuring your in-app ad revenue data with AppsFlyer, your product and marketing teams can better collaborate around common KPIs and unified performance data, improving your user acquisition, engagement and retargeting to improve both your bottom-line LTV/ARPU.

  3. Automate Your Revenue Growth with Audiences
    Audiences is the easiest and fastest way to keep all of your partners in the loop, dynamically syncing your target segments across multiple providers from a single dashboard. Build Audiences that target users who generate the most ad views to improve your retargeting and lookalike targeting, increasing your in-app ad revenues.


To learn more about our ad revenue reporting, now with Facebook Audience Network support, please speak with your success manager or schedule your AppsFlyer demo today.

The post 3 Ways Marketers Are Using Mobile Ad Revenue Attribution to Boost Their Performance appeared first on AppsFlyer.


Barcelona After Dark – Your Ultimate Party Source for MWC 2018!

$
0
0

Hola señoras y señores! February, the shortest month of the year, is famous for the Superbowl, Valentine’s Day and for being really (really) cold, among other things. Personally for me, for the 10th(!) time, it is also famous for being Mobile World Congress month!

You’re probably already trying to figure out what your week at the show is going to look like, and work on your gameplan to make the most of what it has to offer. And as always, I’m here to help! I’m happy to welcome you to the third annual, all-encompassing, guide to the MWC 2018 party scene. So buckle up and put on your comfy shoes, it’s going to be a crazy week. Let’s go!


Sunday, February 25

  • 18:00-22:00 Mobile Sunday 2018 with Tech.eu

Antiga Fàbrica Estrella Damm, 515 Carrer del Rosselló

Mobile Sunday is back! The annual premier networking event in Barcelona taking place the evening before the Mobile World Congress and 4YFN kick off. Get your ticket here.


Monday, February 26

  • 21:00- 03:00 – MWC Urban Rave

The Sutton Club, Carrer de Tuset St. 13

Hosted by AppsFlyer, in partnership with App Annie, Google, Remerge and Segment. If you’ve been to Mobile World Congress, you know you can’t miss this party. If you haven’t been yet, you’ve probably heard stories. Spoiler alert – they’re all true! Join us for the biggest and most highly anticipated party of the year. This concrete jungle experience is guaranteed to rock your world and blow your mind. Request an invite here.


  • 19:00-02:00 Smadex & Axonix MWC 2018 Drinks

Margarita Blue – 6 Carrer de Josep Anselm Clavé

Come by for one or more drinks to chill after an action-packed first day at MWC. Please note this event is invite only, and you can request an invite here.

  • 22:00-00:30 MWC Networking Event – Dutch Mobile Community 2018

Red Fish, Carrer de la Marina 7

Wouldn’t it be nice to relax with beverages and finger food after a long day at the Mobile World Congress? Join the legendary Dutch Mobile Community event at the fantastic restaurant Red Fish in Barcelona. The Dutch Mobile Community is all about sharing knowledge, doing business and building international relationships and contacts. It’s a place designed to ‘unwind’, allowing you a chance to not only take a break from the hectic congress pace but give you the opportunity to meet like-minded partners, businesses and investors in a zero-pressure environment. Sign up here.  


Tuesday, February 27

  • 17:00-18:30 AppsFlyer’s Happy Hour: Booth 8.1#F41

Didn’t get enough quality time with the AppsFlyer team? We got you! Wrap up day 2 with drinks and friends at our booth bar.


  • 18:30-20:00 IMA MWC18 Cocktail Party

Fira Gran Vía, Hall 2 2 E50 08902 Hospitalet de Llobregat

As an IMA graduate (class of 2011), I will never miss an opportunity to praise this awesome team. Come network with the movers & shakers of the Israeli startup community. Meet leading startups with disruptive & innovative products who are shaping the digital/IoT/Big Data/Cyber domains. Drinks, snacks and great people. Sign up here.

  • 19:00-22:00 DrinkEntrepreneurs MWC & 4YFN

96 Carrer de Pamplona

Join 200+ entrepreneurs for a special MWC/4YFN edition of local DrinkEntrepreneurs meetup. Perfect place to start the night and meet with fellow entrepreneurs. Register here.

  • 16:00-19:00 IoT Garden Party
    Networking Garden GG8, Fira Gran Via

Join the ONLY dedicated IoT Networking event at Mobile World Congress 2018! Come and meet the leading lights of the global IoT industry. Discuss future trends and the big ideas with IoT Thought Leaders, analysts and experts. Drinks, nibbles and entertainment are included. Numbers are limited and entry is invitation only. Secure your spot here.

  • 19:00-22:00 MWC Online Dating Industry Rooftop Party

PlayaMedia S.L., Carrer de la Mestrança, 59-5°, 08003 Barcelona

From the words of the organizers: Come and join us at our MWC18 Networking party! Our name is Playamedia, we do Community Management and Marketing for dating sites/apps and we would like to open the doors of our beautiful office rooftop located in Barceloneta for any dating industry players, affiliates and ad networks to connect in a relaxed environment with drinks and an amazing view! Get your tickets here.

  • 19:30-23:00 Women in Mobile – MWC event

La Bonne, Sant Pere Més Baix 7

Incredible women are changing the world all around the globe. The mobile community in particular has been fortunate to have some of the most inspiring women in tech hold significant leadership positions and propel our industry forward. This event is the perfect opportunity to learn from some of these leaders and listen to their mobile success stories. The speaker line-up is 100% women (male colleagues are more than welcome to attend and contribute). The 2018 edition of Women in Mobile will focus on Personalization Through AI. Get your ticket here.

  • 19:30 – 22:30 LADIES, WINE & DESIGN at FIUHOUSE

Carrer del Carme 42

Only a very small percentage of creative directors are women, and LW & D wants to help change this situation from round tables, portfolio reviews and creative meet-ups. In the past year, LW & D has held its events in more than 120 cities around the world. Sign up here.

  • 20:00-00:00 Mobile Marketing Mixer 2018

Fàbrica Moritz Barcelona, 39 – 41 Ronda de Sant Antoni

Masterclassing and Mobile Marketing Magazine are hosting the Mobile Marketing Mixer for the 7th year running at the old Moritz beer factory – Cerveceria Moritz. An open bar, canapes, entertainment and great music are included. Register here.

  • 19:00-21:00 Digital Turbine & Oath Happy hour

Ocana DF Plaza Real 13, 14 & 15

Digital Turbine and Oath teamed up to host a Happy Hour filled with great tapas, and tasty drinks. RSVP here.

  • 20:30-00:30 MoPub Party@MWC 2018

The W Hotel, Salt Restaurant & Bar Passeig del Mare Nostrum Barcelona CT

Join industry leaders and the MoPub team at their annual MWC bash at The W Barcelona. What’s on the menu? An exclusive evening where you’ll make lasting connections with leading publishers, demand partners, and marketers while enjoying Barcelona’s amazing food, drink, and entertainment. Make sure to RSVP if you want to attend, as the party is invite only.

  • 17:00 – 18:30 “INVEST IN PROVENCE” Happy Hour

Fira Barcelona Gran Via, S4M, Hall 8, stand 8.1A67

Join this networking cocktail to celebrate the S4M “Invest in Provence” award and meet the players of the Aix-Marseille French Tech ecosystem. Sign up here

Wednesday, February 28

  • 17:00-18:30 AppsFlyer’s Happy Hour: Booth 8.1#F41


Let’s raise a glass to the end of day three! Come by our booth for a toast and a shimmy (surprise DJ is confirmed!)

  • 20:00 – 22:30 QUOBIS tapas party – MWC

27 Carrer del Marquès de Campo Sagrado

Enjoy the official Quobis party at the MWC Barcelona with a glass of wine and some delicious Asiatic and Catalan tapas. Register Here.

  • 19:00-01:00 Swedish Beers – #13 Barcelona Edition

(location TBD)

The name alone should be enough to make you want to join this shindig. Be prepared to see friends old and new, chat, enjoy a few drinks, and have a good time. This event is casual, so you can leave your suits and ties at the hotel. Sign up here.  

  • 19:00-23:30 #MWC18 ▪ Networking Event By TechTribe

Barceló Raval, 17-21 Rambla del Raval

TechBribe have put together a special networking event, and they’d love to see you there! Come and meet international talent from different fields, local and foreign startups, and enjoy networking activities as well as a live concert in the heart of Barcelona. Get your spot here.

So many parties, so little time. There are lots of great events this year, so choose wisely, and party hard! See y’all in Barcelona.


Did I miss your party and you want to be listed here? Write it up in the comments below👇 !

The post Barcelona After Dark – Your Ultimate Party Source for MWC 2018! appeared first on AppsFlyer.

4 New Ways to Boost Your Efficiency and Impact with Master API

$
0
0

Mobile attribution is more than just another marketing data point, it’s the first step in your customer journey. AppsFlyer’s Master API provides mobile businesses with a powerful pipeline that syncs directly into their preferred BI platforms, introducing deeper insights and new efficiencies across the organization. Here are four ways mobile marketers, analysts, and executives are using Master API’s new weekly reporting, cohorts and Protect360 KPIs to improve their agility, insight and impact.


1. Find Broader Trends, Faster With Weekly Retention Cohorts

Many apps only expect their customers to engage once or twice a week. For example, top users for many grocery delivery apps only need to engage a few times a week. Daily reporting may show an average of 200k users per day when a more meaningful metric would be one million users per week. When optimizing new customer engagement, user acquisition, the user journey, retention and revenues, daily reporting often looks like an incoherent roller coaster.

Master API’s new weekly reporting cohorts are already helping leading mobile businesses normalize their daily engagement into more accessible and user-friendly weekly trends.


2. Automate Your Data Sync, With Sessions, Revenue and In-App Event Volume Cohorts

Data savvy mobile businesses often directly connect their data across platforms to automate their performance optimization. Master API’s new sessions, revenue and in-app event volume cohorts make it easier than ever to automate your paid retargeting and cross-platform re-engagement, programmatically improving your revenues and retention.

For example, in many gaming categories, most new user engagement occurs within the first 10 days after the install. Marketers for these gaming apps may want to optimize their marketing efforts based on their day 10 sessions and ARPU. With Master API, building and analyzing these cohorts is a snap.


3. Use Protect360 to Identify Fraud Across All Your Apps

Protect360 data in MasterAPI makes identifying mobile fraud trends at the macro, company-level, far easier. Smart fraudsters sometimes create a certain amount of in-app engagement to hide their fraud, particularly in the first few days following an install. Traditionally, identifying in-app engagement fraud relied on either (a) identifying outlying hyper-engagement patterns or (b) conducting a deep analysis of device metadata – such as a high amount of engagement from a particular model phone.

With the introduction of Protect360 KPIs in Master API, marketers with Protect360 access can now utilize our anti-fraud insights including DeviceRank ratings to easily identify fraud, clean up their in-app engagement metrics and insights. Sort, mix, multi-select and analyze your fraud data any way you want to, right alongside your other AppsFlyer data in your BI. With all of your this rich, detailed data available at the Account level, identifying and addresses your fraud sources and vulnerabilities has never been easier.


4. Clear Out Bad Actors and Fake Users to Protect Communities

Many mobile businesses require strict security and privacy for their platforms. Protect360 KPIs in Master API provides these businesses with strong, attribution-based fraud protection. This data can be used to increase their overall platform privacy and security, in addition to improving attribution and analytics accuracy.

For example, a leading alternative-lifestyle dating platform invests heavily in their internal security to ensure their users enjoy a safe, secure, environment. As a social platform, both “trolls” and private investigators looking to ‘out’ their members and users is a constant threat. By syncing their Protect360 KPIs over to their internal BI, a leading alternative lifestyle dating app is not only identifying suspicious installs but generating a multi-point rating of their users and accounts, flagging and removing accounts that are likely device farms indexing their user database.


To learn more about Master API and how these updates can help you improve your measurement, speak with your Success Manager or book a demo today.

The post 4 New Ways to Boost Your Efficiency and Impact with Master API appeared first on AppsFlyer.

Universal Links, URI Schemes, and the Tech Stack: How Do They Apply To Deep Linking?

$
0
0
deep linking guide

Deep linking is an essential component in any successful mobile marketing campaign. The value it delivers by connecting a fragmented mobile ecosystem and enabling a superior mobile user experience is well known. However, very few truly understand how this is done, and are often confused by different types of links used to route users from point A to point B within a mobile device.

To help make sense of it all, we’ve just released Everything a Marketer Needs to Know About Deep Linking — the most comprehensive deep linking guide in the market, with 6 in-depth chapters covering everything from explaining basic terms, through deciphering Universal Links, to understanding the relationship between deep linking and attribution.


What is a deep link? It’s just a link, which is a URL

Generally speaking, a link is a digital address, name or reference to a file on “The internet”. A deep link is a link, or a special URL that directs users to a specific spot within a website or an app.

Deep linking revolves around URLs, or URIs (Uniform Resource Identifier), which is a string of characters used to identify the name of a resource on a network — an address.

Apps installed on a device can directly open via a unique registered scheme called a “URI Scheme”. If we use the address analogy, think of URI Schemes as PO Boxes. Unlike regular mailing addresses, you can only send mail to a PO Box if it is regulated with the postal service. Similarly, an app’s unique URI scheme will only work if it is set up by app engineers and registered with the app stores.

Deep link or not deep link? That is the question:

Clearing up the confusion about Universal Links

What is the relationship between deep linking and Apple Universal Links (iOS)/Android App Links (Android)? Let’s try and set the record straight:

Apple Universal Links and Android App Links are not really different “links”, but rather mechanisms applied to some links that control how a user is routed to an app. For example, Apple Universal Links are an Apple standard deployed on iOS, which immediately direct a user to an app, assuming it is installed on their device.

Universal Links and App Links are not link redirects, but rather a mechanism which, in certain scenarios, turns regular old links into app deep links. The connection between these links and attribution links can best be explained as follows: Universal and App Links are a standard that can be applied to any link, and the best attribution and deep linking vendors support this standard.

However, it is important to stress that these links have several limitations to be aware of, particularly as they apply to Apple Universal Links. The most important limitation is that since Apple Universal Links are not a redirect but rather a system applied to links to open an app, it’s very difficult to establish true click tracking. Which means there is no tracking or attribution.

Since the app opens immediately from Apple Universal Links, a redirect through a webpage to count a click to a server is not available. To work around this, a marketing team would have to setup a server and manually count the click from the app.

A much easier solution is to use an attribution and deep linking tool that supports Apple Universal Links and would therefore automatically execute this type of tracking for you.

The following diagram will put things in place:deep linking routing flow

Attribution & deep linking: The 1-2 knockout punch

Despite anything you might have heard about attribution and deep linking, it is extremely important to stress that, ultimately, deep linking is a feature of attribution, and not the other way around. That means that if your attribution provider supports deep linking, there’s no need to use different vendors. In fact, it is strongly recommended to use a single partner. 

Deep linking is now a commodity and all major players offer some level of capabilities. The specialty is attribution. When exploring different solutions out there, you should first make sure that you select a tool that delivers what you need from attribution – this is the bottleneck. Most attribution tools also provide the ability to deep link

Attribution and deep linking are at the very heart of the mobile growth stack. Effective performance marketing is only possible when you:
1. Know the source of your growth (attribution).
2. Ensure that your customers get the optimal user experience when visiting your app for the first time (deep linking).

How you define, build and maintain your tech stack will make or break your success on mobile. It is important to focus on consolidating your stack, especially as it applies to attribution and deep linking.marketing tech stackTo get more details, and touch upon other subjects related to deep linking including deferred deep linking, detailed use cases, and a full glossary of terms, check out Everything a Marketer Needs to Know About Deep Linking, and start connecting your mobile universe.

The post Universal Links, URI Schemes, and the Tech Stack: How Do They Apply To Deep Linking? appeared first on AppsFlyer.

How to Drive Mobile App Discovery and Engagement with User Invites

$
0
0

For every emerging business with ambitious visions of launching their product and having users crash their servers with purchases, the reality quickly sinks in; it’s a tough world out there, and competition is steep.

With more than 2 million apps in the App Store, 3.5 million apps in Google Play and more than 200K new apps every month, app discovery is a real and alarming challenge.

There are endless opportunities to stand out from the crowd and expand your reach. But just before you dump more marketing budgets on sophisticated paid campaigns, make sure you don’t neglect the obvious–word-of-mouth marketing (WOMM).

According to a great deal of research, not only is word-of-mouth the #1 source of app discovery globally, it was also found to increase the customer loyalty of your existing users by having them engage more with your app. This is something that marketers simply cannot afford to ignore, and it emphasizes just how important of a role word-of-mouth plays in mobile user acquisition and engagement strategies.

You’ve Been Invited.
There is one key point that every business considering or instituting a WOMM strategy needs to think about: the user experience. The ultimate success or failure of your WOMM hinges on how you connect with your users; both the existing and the newly acquired user. Remember, no matter how generous your referral program is, if you don’t prompt the offer at the right time, in the right place and with the right user experience, you are going to fail.


Hacking Word-of-Mouth with AppsFlyer’s User invites

AppsFlyer User Invites builds on OneLink deep links, which ensures a frictionless user experience across every platform.

Here’s how it works:

The Referrer
When an existing user wishes to ‘invite a friend’, he will be prompted to select how he’d like to spread the word; SMS, email or social. A (deep) link will be automatically generated for easy sharing through the desired channel.

Access to the user’s contacts is key for delivering the right user experience and avoiding your user having to type in names, phone numbers or email addresses manually.

Once the invite is sent, you will be able to track the users that are most likely to invite friends, as well as their preferred channels, by generating a custom in-app event or using the ready-made trackInviteSent in-app event already encapsulated in the User Invites’ API.

The New User
As mentioned before, links generated by ApssFlyer’s user invites are deep links. As such, when the new user clicks on the invite’s link received, he will be sent to the specific in-app destination directly-regardless of whether or not he has previously installed the app (first routed to the app store in the latter case). 

When the new user installs the app from this link, AppsFlyer passes data such as the referrer name, his avatar, the campaign name, promo code, discount and more to the app, delivering a contextually relevant experience based on these data points as soon as the user launches the app for the first time.


Amplify the Effectiveness of User Invites [Tips]

  1. Be Creative: Avoid dummy text. Seriously. Take some time to develop creative and personalized content based on the stuff you already know about your users. Your users are smart, and with the deep insights into your users’ segments available on AppsFlyer’s dashboards, so are you.
  2. Personalize: Use the referrer’s user information to personalize the onboarding experience for the new user. If you’re in gaming for example, instead of a general message, welcome the new user with a personalized message such as “Hey John! Join your friend Michelle in an epic battle after you complete the tutorial”.
  3. Incentivize: Give your users a good reason to connect. The key is to offer the right incentive at the right time. This will be different for every company. Depending on the industry, you may want to offer discounts on items in your user’s wish lists, unlock more levels in your game or offer more storage space just when they’re out of juice.
  4. Optimize: Never stop evaluating your performance and making course corrections. Adaptability and agility are key to long-term, sustainable growth.


Bottom Line

Mobile today is more agile and fragmented than it has ever been. While every existing user can lead to an opportunity, it’s important to do things the right way. 

With AppsFlyer’s User Invites, hacking word-of-mouth is easy. It’s about a unique and frictionless user experience. A share-worthy experience. And its performance? Just watch the conversion and retention rates on your AppsFlyer dashboard turbocharge.

To learn more about User Invites and join the thousands of apps already using AppsFlyer, click here or schedule a demo today.

The post How to Drive Mobile App Discovery and Engagement with User Invites appeared first on AppsFlyer.

A New Approach To Advanced Fraud Bot Protection: Macro Behavioral Modeling

$
0
0

One of my favorite movie posters is from the movie Being John Malkovich. Hundreds of different people are holding John Malkovich masks, making it very hard to determine which is the real John. The world of mobile fraud is very similar. Fraudsters work very hard trying to blend in; sending realistic-looking sets of impressions, clicks, installs and in-app activity. The sheer volume of fraud often makes it extremely hard to determine the difference between legitimate and fraudulent traffic, particularly when the fraud is mimicking human behavior.

Identifying Advanced Bots
A few weeks ago, one of our Protect360 data scientists grabbed me before my first cup of coffee. She was very excited about what she had found.

She was deep into a fraud analysis, working on a particularly interesting anomaly. The team had detected a resurgence in bots attempting to send false clicks and installs. Back in 2014, we called this type of fraud SDK Simulation (some now call this SDK Spoofing) and deployed security mechanisms in our SDK to actively block this activity. After isolating an app heavily targeted by these bots, the data scientist dove deeper, identifying a number of new, advanced bots. She then identified a series of unique behavioral markers that could be used to accurately identify these new fraud bots.

Fraud Distribution Analysis
Our next step was to understand the scale and impact of this fraud: how widespread it is, and how much these new advanced fraud bots are costing marketers. Based on this initial fraud analysis, our anti-fraud data scientists developed a series of new fraud signatures. We then set up a short regression analysis based on these new detection mechanisms. By analyzing the pre-mechanism activity and comparing it to the post-mechanism activity, the team projected that the new mechanism would block about 0.05% of this class of traffic, roughly matching our team’s initial predictions.

Fraud Signature Validation
The next morning, these new mechanisms were sent to one of our data science team leads for further review. The senior data scientist ran a longer regression analysis, applying this new mechanism to a far longer timespan – instead of going back just one week, his regression analysis looked back ten weeks, exploring activity across all apps and clients. This secondary analysis revealed some surprising results. Over the previous couple of weeks the new behavioral identification mechanisms had flagged almost 5% of this class of traffic as fraud! Either the initial fraud signature was flawed, our projected impact was based on an aberrant data set, or there were some other factors we had not yet identified.

While unmasking a new fraud signature with such a large footprint raised lots of excitement, this was 100x larger than our initial projections. Clearly, something was off in either our new fraud model or our initial projections.

There was clearly another variable skewing either the initial test set or our broader validation set. The team started to dive deeper into this 10 week period, as well as zooming further out, looking at different time periods and other fraud trends to try to find correlations that could explain the apparent gap. They looked at performance trends, variations in the number of installs, media sources, in-app behavioral patterns, conversion rates and more, but none of the metrics really stood out. The team then zoomed even further out, analyzing regional and vertical benchmarks, as well as comparing individual apps benchmarks.

Isolating The Key Variables
This broader macro-analysis revealed the key variable driving these abnormalities: a specific group of apps saw a dramatic spike in installs, all in the same week. The number of installs on that week had increased ten-fold.

Now that we had isolated the problematic cohort of apps, we needed to identify what drove this install spike. When we ran our latest behavioral analysis fraud signatures on this same cohort of apps, we found that about 90% of their false growth was due to a series of advanced fraud bots. While these more advanced bots had previously evaded detection, we now knew exactly where and how the fraud was occurring.

But what about that apparent gap in our initial projections? In retrospect, this spike in fraud had actually normalized our initial regression analysis. When stripping out our other fraud protection mechanisms, we found that our new anti-fraud mechanism would, in fact, affect about 5% of this class of traffic.

Conclusion
In a world challenged with fraud activity, finding the right behavioral patterns in the data haystack is not easy. Oftentimes, a mix of different types of fraud serves as an effective mask for newer, more advanced fraud bots. The only way to accurately detect and block these advanced bots is through the strategic application of machine learning across massive data sets, followed by extensive hands-on macro and micro level analysis to validate the learning. Like a good anti-virus solution, this must be an ongoing process, identifying and blocking the latest threats as they appear.

We look forward to sharing more about our findings, as well as this new hybrid of behavior and distribution modeling over the coming weeks.

The post A New Approach To Advanced Fraud Bot Protection: Macro Behavioral Modeling appeared first on AppsFlyer.

The AppsFlyer Performance Index Edition VI is Out for MWC With Some Surprising Findings

$
0
0
AppsFlyer Perfomrance Index best mobile ad networks

The Mobile World Congress (MWC) in Barcelona is just days away and our new AppsFlyer Performance Index is officially online — with some surprising findings! This is the third time we’ve release the Index in line with MWC, and advertisers and publishers have been inquiring about it now for weeks.

The Index is the established industry-standard for the performance of mobile media source. From the beginning, our insights have offered apps and publishers real business value.

This release is the 6th edition of the Index, and it features some new and exciting rankings: an industry-first app retargeting index and a long-term week-12 retention index. With app engagement attracting so much attention from app marketers (as it should!), these new rankings can certainly help improve dwindling engagement rates.

The ROI (ROAS) Index, which was introduced in Edition V, now includes a category and platform breakdown, covering over $1 billion in revenues.

Overall, we looked at 6.5 billion installs and 15 billion app opens of over 6,000 apps throughout the second half of 2017.

Insight #1: New players drive change in non-gaming rankings
Discovering new names in powerful spots is definitely refreshing, as was the case in the non-gaming category. There were six new players in the top 15: Global Wide Media, Digital Turbine, Leadbolt, Moloco, Adperio, and Liftoff. This tells us two things: the media space for non-gaming apps is more open to change than gaming, and there are a number of players that have been somewhat under the radar but are definitely worth trying.

Insight #2: Google climbing but Facebook is still king
The power of the duopoly in mobile advertising is well documented. Our data shows time and time again that Facebook and Google are in a league of their own. The most interesting finding within the duopoly has Google taking a significantly larger piece of the app install pie. How much larger you ask? 40%!

Facebook, however, remains the undisputed leader in the space. Not only has the social giant reached the #1 spot in the power rankings of the gaming and non-gaming performance indexes, it has also come out in front in both the ROI and retargeting indexes!

Insight #3: Fraud is still here (more than ever actually…)
Since fraud began generating headlines in the app ecosystem, one could have concluded that it would lead advertisers and vendors to start taking the threat seriously. And this would in turn at least reduce the threat. Unfortunately, the opposite is true. We’ve found that the fraud rate in H2 was 5% higher than H1.

Clearly, the mobile media landscape is a mixed bag: there are those that take fraud very very seriously and those that, well, don’t. What’s also clear is that fraud is extremely dynamic and requires continuous and meticulous monitoring.

Rankings
Which media sources stood above all others? Here’s a taste of the top global ad networks.

Universal Non-Gaming Index — Top 10

Universal Gaming Index — Top 10

For the full picture, including volume and power rankings for iOS and Android across eight regions globally plus the all new retargeting and ROI indices, click below. See you at MWC! Come say hi. We’re in Hall 8.1 #F41.

The post The AppsFlyer Performance Index Edition VI is Out for MWC With Some Surprising Findings appeared first on AppsFlyer.

Turn Web Traffic Into Highly Engaged App Users With Web-to-App Banners

$
0
0

Over the course of the last few years, there have been countless debates about the demise of mobile web at the hands of native apps. With the rising cost per install and a crowded marketplace, this mindset has become a thing of the past. Companies are becoming increasingly aware of the crucial role mobile websites play in the mobile growth strategy — as the ultimate entry ticket to the world of search and app discovery.

Whereas mobile web has a number of inherent advantages; broader accessibility, compatibility and cost-effectiveness, mobile apps is where you really scale.

To help app marketers get the most out of both mobile web and app spaces, AppsFlyer has created Web-to-App Banners.

Adding a Web-to-App Banner to your mobile website is an incredibly valuable tool for converting web traffic into app users. Not only is it a frictionless way to drive users to your app, it’s proven to convert high quality users into highly engaged and loyal app users.

Shortening The Path to Purchase

Powered by OneLink, AppsFlyer Web-to-App Banners harness the power of deep linking. Unlike banners such as Apple Smart App Banner, our banners work across every platform (iOS, Android, and desktop) and deliver a seamless user experience through install.

As you would expect from a deep link, when a user clicks on the banner call-to-action (CTA), he is automatically sent to the app store to install the app. Our Web-to-App banners go a step further. Once the app is launched, the user can be routed to the matching in-app content he was viewing on mobile web and be welcomed with a custom message. This tailored approach gives app marketers an edge in holding users’ interest, furthering them along the activation funnel.

AppsFlyer Makes Web-to-App Banners Incredibly Easy

Web-to-App Banners have become a core part of any mobile first business. They’re powerful, unintrusive and clean, and the real beauty is that they are also very easy to implement.
With AppsFlyer’s open and ready to go Web-to-App Banners framework, you can create smart banners and customize them to match your brand with just a few simple steps.

All you have to do is create an AppsFlyer account, drop a few lines of code to your website and you’ll have a Web-to-App Banner working across every possible platform — even the most tricky edge case. 

To learn more about our Web-to-App Banners, check out the code on GitHub or schedule your AppsFlyer demo today.


The post Turn Web Traffic Into Highly Engaged App Users With Web-to-App Banners appeared first on AppsFlyer.


3 Things You Need to Know About the Southeast Asian App Market

$
0
0

When people think of Southeast Asia, they think white sandy beaches, spicy food, and eternal sunshine. While they are mostly true except for rainy season that lasts months at a time, it is an extremely exciting region not only for vacationers but also marketers and developers. The region boasts mobile users who spend the most time on their phone globally. If we already have all their eyeballs, the logical next question is, how do we generate revenue?

Thailand, Malaysia, Singapore, Vietnam, Indonesia, and Philippines are all projected to experience double digit growth in digital ad expenditures through to 2020, while mobile ad spend is expected to more than double in the same period.

mobile ad spend in southeast asia

Before you start booking your next work vacation and drawing up your marketing plans for the region, we have identified some pointers that could help you better ride this incredible wave.

1) Try to refrain from looking at Southeast Asia as one big market

Over the years, foreign marketers have moved passed looking at Asia as a collective market, but still fall into the same trap when looking at Southeast Asia. Many marketers look at Southeast Asia and think the similar strategies apply for all countries across the region, but truth is that apart from its geographical proximity, the countries cannot be more different.

  • Religious and cultural differences: Indonesia is the world’s most populous Muslim nation, the Philippines has more Catholics than the US, while Thailand and Vietnam are predominantly Buddhist. Understanding the main festivities and shopping behaviors go a long way to mapping your your media plan for the country. You will realize that almost nothing overlaps, and peak season for one country very likely coincides with low season in another.
  • Mobile spending behavior: On paper, the GDP per capita of Singapore is over 20 time that of Vietnam, but Vietnam leads the pack in the region, and ranks No.7 globally in share of buying users, and No.7 in ARPU Per User, way ahead of any other countries in the region. (check out The State of Gaming App Marketing for more.)
  • Business opportunities: Southeast Asia boasts countries with core strengths in different verticals, talent and support from the private and public sector. Vietnam is a gamer’s nation, home to the region’s largest game studios and community of indie game developers. Indonesia, due to its large scale is home to the region’s largest eCommerce companies, and continues to grow at neck breaking pace. Singapore has long utilized its strong historical background as the financial hub of the region and proximity to neighboring countries to attract global executive talents.

2) Mix up your media sources

Southeast Asia’s media sources are as diverse as its countries. While there are quite a few global players that have traditionally performed well, many marketers find it most effective to mix and match their media sources across different countries and verticals to suit their media strategy. Global and regional networks usually have the most advanced targeting, platforms, and support. Marketers in the region find these larger networks best for always on campaigns.

Local networks have varying degrees of volume but can be very effective in certain markets in targeting clients for installs through cashback apps, messenger apps, or utility apps to name a few. Thirdly, many marketers have also found success in direct publishers. In many cases direct publishers can be very cost effective when tied in with offline campaigns with a wide reaching audience.  

3) Keep an open mind and experiment

Lastly, be adventurous and play around with different ad formats, tools and strategies. Most of the markets in Southeast Asia are too young to have any tested and proven methods. Here are some things that would help you to scale and experiment efficiently:

  • Mobile app and alerts: If you plan to be in Jakarta or Bangkok, you will be spending most of your time in traffic. For those optimization and monitoring on the go, make sure your tools and dashboards can be easily accessed from a mobile device
  • Segmentation: Many affiliates and smaller networks in the region do not have advanced segmenting and targeting capabilities. That’s why it’s important to take things into your own hands and segment your users with other segmentation tools (i.e. from your attribution provider, DMP etc.).
  • Deep Linking: Running campaigns on a billboard, an interactive screen in a mall, or wrapped around the skytrain, and not sure if the user is on iOS, or Android, or if they already have your app or not? A single smart link with deep linking and deferred deep linking capabilities optimizes the user journey for every one of these scenarios, ensuring your users get a contextually relevant experience connecting the promotion to your app.

The post 3 Things You Need to Know About the Southeast Asian App Market appeared first on AppsFlyer.

3 Ways To Boost Your Marketing Impact with Audiences

$
0
0

Audience segmentation helps mobile marketers improve user acquisition, engagement and revenues by improving their targeting and messaging. However, few marketers are really taking full advantage of this strategy due to a mix of (a) concerns about sharing user data, (b) the manual effort of extracting and uploading audience lists, (c) the cost of maintaining dynamic data integrations, or (d) the effort needed to create and maintain each audience across every provider.

AppsFlyer Audiences closes these gaps, bringing the full power of smart, dynamic audience segmentation to marketers – without needing to increase your headcount of wait on your BI team. Want to add a new partner? All it takes is a click. With the addition of overlapping and excluding logic, as well as deeper device metadata, it has never been easier to segment and target your marketing efforts.

Let’s explore three ways marketers are using the newest features in Audiences to improve their performance.

Improve Shopping App ARPU

Goal: Stop advertising to frugal shoppers, double down on big-ticket buyers

This US, fashion-forward shopping app wanted to improve their ARPU and mobile revenues. To meet this goal, they worked with two different segments:

  • Improve Active Shoppers audience by excluding Frugal Shoppers
    This marketer’s initial audience was Active Shoppers – customers who had recently checked out. This audience was synced to Facebook for lookalike targeting, as well as retargeting providers to increase their repeat purchase activity. However, their ARPU was not quite as high as they had hoped. An analysis of their shopping cart activity revealed that about 30% of these new users were only purchasing discounted sale items.

    In order improve their Active Shoppers performance, they created and excluded a new audience, Frugal Shoppers – shoppers who had only purchased sales items.

  • Target and activate High-Fashion Shoppers
    An analysis of their activity and cohort reports revealed that they had a strong and growing segment of high-fashion shoppers. Not only were these users very engaged around the latest fashion trends, they were actively purchasing the latest styles.

    By syncing their High-Fashion Shoppers to their push messaging and lookalike targeting providers, this fashion app was able to drive repeat high-value purchases, while improving the ROI of their UA activities.


Drive Legacy Gaming App Power-Users to Download The New App

Goal: Identify and engage legacy game whales who have not yet downloaded a new title


With interest in their legacy gaming titles on the decline, this European gaming publisher had recently released a new app. The new title had very promising retention and monetization performance. They wanted to introduce their legacy app’s whales (heavy users) to their new title.

Using Audiences, they set up a number of targeting parameters. First, they added users who had opened their legacy title at least 60 times in the last 90 days. Then, using the Or functionality, they added their “whales” from each of their other legacy apps. To complete their audience, they used the Exclude feature to remove any whales who had already installed their new title. In under a minute, they added each of their retargeting platforms, dynamically syncing this Audience for a retargeting campaign promoting the new title. Best of all, because Audiences maintains a regular sync, whales who installed the new game were automatically excluded from these retargeting efforts moving forward.


Drive Engagement Around New App Content

Goal: Drive relevant in-app engagement around a fresh television content

This global video platform wanted a smarter way to keep their audiences synced. In the past, every time one of their major series’ returned for a new season, they ran campaigns targeting viewers who had enjoyed similar content.

However, constantly downloading and uploading their viewer and device lists to each provider for retargeting, push messaging and email campaigns became unsustainable.

With the return of a popular reality-tv series, they began using Audiences to streamline their viewer activation. The started by targeting viewers who had previously watched two episodes of this reality-tv series. They then added two Exclude rulesets, removing viewers who had already watched one or more episodes of this show’s latest season and removing users who had never watched more than two videos. With just a few clicks, they synced their audience across their retargeting, email marketing and push messaging providers.

What used to take an hour or two of manual work every day, requiring the assistance of their BI team (to pull data) and a campaign manager (to format the data for each provider, and then upload) now takes only a couple of minutes. Because all of their providers are already integrated with Audiences, the entire process is seamless from start to finish.

To learn more about Audiences, and how this can help your business, please speak with your Success Manager or schedule your AppsFlyer demo today.

The post 3 Ways To Boost Your Marketing Impact with Audiences appeared first on AppsFlyer.

Protect360 Introduces Anti-Fraud ROI Reporting for the Enterprise

$
0
0

All too often, mobile marketers struggle to quantify the value of their anti-fraud solutions. You paid for the protection, you deserve to know exactly how much you saved across every one of your apps. You deserve to know exactly where and why you are vulnerable, what was blocked and where the traffic came from.

And now you do. As of this morning, Protect360 is the first and only solution to not only deliver enterprise-grade anti-fraud protection, but to report on your cross-app anti-fraud savings. Want to know how much Protect360 saved your entire business? Just open the dashboard, it’s right there! Need to determine how much fraud was blocked from a particular media source, across all of your apps? We’ve got you covered. It has never been easier to measure all of your anti-fraud savings across all of your apps, from one comprehensive dashboard.


With account-level reporting, Protect360 doesn’t just report what was blocked and your fraud savings, but where you may be most vulnerable. Take a look at your account-wide CTIT by region to learn where you may be exposed. Want to increase your protection? Just click straight over to Validation Rules to customize your protection, enhancing your coverage where you need it most.

With over 5.5 billion devices already ranked by DeviceRank delivering protection against DeviceID Reset Fraud, SDK message hashing authentication, and over a dozen more fraud-detection and prevention algorithms and technologies, Protect360 continues to lead the industry in blocking and detecting even the most advanced types of mobile fraud.

With Protect360, you enjoy full transparency into every element of your fraud protection: what was blocked, why it was blocked, where it came from and how much you saved as a result. You can set Live Alerts that notify your team when your fraud benchmarks are rising, and then customize your protection as needed with Validation Rules. And now, with the addition of account-level ROI reporting, it has never been easier to see your savings.

If you haven’t yet experienced the Protect360 difference, speak with your AppsFlyer representative or schedule your demo today.

The post Protect360 Introduces Anti-Fraud ROI Reporting for the Enterprise appeared first on AppsFlyer.

Two New Ways to Accelerate Your Marketing Growth Stack

$
0
0

Setting up and maintaining a marketing growth stack often strains limited resources. At AppsFlyer, we have set up preconfigured integrations with every provider and platform in the world to help take some of this workload off your team. Today, I would like to share two exciting updates.

Leverage Your Expanded Cost Reporting – Now Including Snapchat, Vungle and Aarki!
Measuring your ad spend and ROI used to require either massive amounts of manual work or dedicated third party providers. Over the last few years, we have worked closely with leading media sources to close this gap. Our direct, preconfigured integrations can now automatically report your media spend/cost data for approximately 90% of all installs. This media spend is reported right in your AppsFlyer dashboard – no custom code or postback maintenance required. With just a few clicks, you’re all set.

By collecting cost data and matching it with your LTV, you can automatically calculate your ROI and optimize towards your bottom line. Over the last six months, marketers that measured their cost and revenues with AppsFlyer saw their ROI improve by 20%! To take this a step further, the largest apps that measure their cost and mobile revenues with AppsFlyer saw a 3X improvement in their ROI over just six months!

Optimizing towards what matters has a very real impact on the bottom line. Over the last month, we have added cost support for over 50 new ad networks, including Snapchat, Vungle and Aarki, bringing our total cost coverage to about 90% of all installs! On a related note, we have also added agency support for Snapchat, as well as impression and click reporting for both Snapchat and Apple Search Ads, providing broader multi-touch attribution support and insights for both of these powerful media sources.

It has never been easier to measure your cost, LTV and ROI. To get started, check out our Help Center, speak with your Success Manager or schedule your AppsFlyer demo today.  


Sync Your Audience Segments Across Providers – Now With Oracle Data Cloud
AppsFlyer’s integrated Audiences are the most efficient way to sync your mobile target segments with your broader marketing tech stack, without leaving the AppsFlyer dashboard or setting up custom mappings. Simply define your Audiences based on your mobile marketing data (impressions, clicks, attribution data), mobile engagement (rich in-app events) and metadata (app version, geo and OS version). Then select your preferred destination, and your Audiences will automatically sync over.

All partner integrations are fully pre-configured. Once setup, your Audiences will update dynamically, expanding your marketing reach without requiring any additional marketing tech stack investment or maintenance.

With the addition of Oracle Data Cloud (BlueKai) to AppsFlyer Audiences, marketers can further extend their mobile data reach. Our Oracle Data Cloud integrations will allow you to:

  • match your mobile (AppsFlyer) Audiences with your first-party data in Oracle to optimize your web and mobile engagement
  • target or personalize your emails based on mobile activity
  • extend your target audience activation through Oracle Data Cloud’s audiences solutions

To learn more about our media cost/spend reporting or Audiences, please speak with your Success Manager or schedule an AppsFlyer demo today.

The post Two New Ways to Accelerate Your Marketing Growth Stack appeared first on AppsFlyer.

Top 5 Reasons Why Mobile Attribution Is a Must-Have In Your Marketing Stack

$
0
0

I heard a fisherman say once, “If you’ve got a fancy pole, but you’re using the wrong bait, fishing at the wrong time of day and casting in the wrong places, all you’ve got is a fancy pole.”

So, why attribution?

Attribution arms you with the deep, granular data you need to catch the type of fish you want and as many as you want. Incidentally, it also helps to have a “fancy” pole (i.e., a well-designed app).

OK. Enough with the fishing metaphor. Here’s your list — plus a bonus at the end!


1. Make smarter data-driven user-acquisition (UA) spend decisions

Mobile attribution, when done by a reliable, unbiased provider, will optimize your app’s performance by pinpointing the value of specific channels, ad networks, publishers, campaigns, and even different versions of creatives. Attribution providers can open your eyes to a wealth of cross-network data that can help you boost lifetime value (LTV) and ultimately ROI. They will tell you exactly where you should spend your budget and where you shouldn’t. And this is why attribution is at the very heart of effective marketing.

Let’s put this another way. Once you add attribution to your marketing stack, you’ll ask yourself, how could I have not been doing this all along? Attribution truly changes the mobile app game when it comes to performance marketing. And as you will learn further down this list, it will make your life a whole lot easier.

Mobile attribution and marketing analytics from above:

2. One universal SDK for your entire advertising ecosystem

Ad networks require apps to provide an SDK for measurement and optimization. SDKs for each ad network need different implementation and quality assurance. Apps also need to format and maintain proprietary integrations for each ad network. These are daunting tasks; too much for most app marketers.

As app marketers scale their efforts, the delay and cost of adding new SDKs for each ad network or manually implementing and QAing postbacks slows their progress, drains technical resources and negatively impacts an app’s performance.

This is why attribution providers offer what is referred to as a universal SDK. The concept is simple. An app integrates only one SDK that can do measurement and attribution for all of its ad networks. Hence the term “universal.” Universal SDKs have already done the heavy lifting, connecting advertisers to the entire mobile ecosystem through integrations with 1000s of media sources.


3. Prevent double or triple charging with a trusted measurement partner

Today, last-touch attribution is the most common and accepted method for attributing installs. If, for example, your CPI (cost-per-install) is $2, the ad network that last touched the user gets the full amount.

Here’s the problem. If you’re not doing attribution, ad networks can claim credit for an install they don’t deserve. If you’re scaling campaigns to several ad networks, each network that logged a touch on a multi-touch user journey can claim credit and charge you for an install. Why? Because ad networks only see their own touches. And you end up paying double or triple the CPI (cost per install) you should be paying.

An impartial attribution provider trusted by both advertisers and media companies can connect all the dots and pinpoint exactly where the last touch came from. Attribution equips you with authoritative data and the confidence that the data is accurate and indisputable.

With this insight, you pay one ad network and one ad network only. The money you save gives your ROI a nice boost and can go right back into user acquisition and re-engagement.


4. Single dashboard: one go-to address for a complete snapshot of your performance marketing

If you’re not working with an attribution provider, you’re probably spending countless resources and man hours trying to make sense of your media data with too many dashboards and/or Excel spreadsheets. Sound familiar? This is a recipe for errors and plenty of missed opportunities for optimizing LTV and ROAS (return on ad spend).

When you run non-organic campaigns — looking for users who are not necessarily looking for you — finding high quality is not easy. It takes accurate, in-depth data, some sophisticated marketing tools, and of course, time. One dashboard will save you lots of time and make finding better quality users and scaling your base much easier.

With all your raw and aggregated data for both paid media sources and organic activity in one place, you will be able to more easily answer this key question: How can you tell if your non-organic campaigns are doing well? Answer: look at your organic users as a benchmark. They are a good indicator of your app’s success, and for good reason. Organic users are considered the best quality users, delivering high ROI and LTV (lifetime value). Doing this important comparison is easy when all of the data you need is in one place.

The full visibility you get with attribution shows you the complete user funnel, from impressions and clicks to installs, in-app events, LTV, and ROAS (with cost data from integrated partners). This would depend on their level of integration with media companies (particularly the big ones).

If you can get a clear picture of each point that led to a user’s tipping point, you can create a more effective funnel and optimize both your ad spend and the quality of your users. Attribution lets you see the whole story — the final touch and the “assists” that led up to the point before conversion — and again, in one dashboard.

5. Leave the data plumbing to the plumber

Doing attribution on your own is not easy — it is best done by a specialist. The mobile landscape is complicated and fragmented with users existing in two very different environments — mobile web and in-app — that require different techniques. There are also multiple identifiers for tracking and matching clicks to installs.

Mobile attribution technologies are advanced and complex. They include real-time integrations with leading ad networks, universal deep linking, fingerprinting, and secure postbacks for data sync across thousands of integrated providers. If this sounds complicated, it is.

Fighting fraud should also be a serious consideration for any app owner. Fraud is a pervasive and dynamic problem for advertisers, ad networks and attribution providers. As mobile ad spend grows, so does fraud, as there is enough of a financial incentive for dubious actors. Fraudsters constantly develop new types of mobile ad fraud, stealing both organic and non-organic users through techniques such as click flooding, malware-based clicks, install hijacking, and resetting device IDs at scale. According to a 2017 AppsFlyer study, just over 10% of installs globally were fraudulent, and app install fraud cost advertisers between $2.2-$2.6 billion.

If you ignore fraud or attempt to deal with it on your own, you’re throwing money away (to the wrong places) and potentially missing out on reaching actual users. Attribution providers are best equipped to fight fraud. They have the resources, tools, expertise and most importantly, massive cross-network scale.

Bottom line: Let a reliable, unbiased attribution provider with a strong attribution platform do the heavy tech lifting and fraud blocking so you can focus on marketing strategy and building a strong user base.


BONUS: Use attribution data to enhance your UX with deep linking

Why is deep linking a must-have tool for acquisition or re-engagement? Think about the user experience for a second: you serve a promotion (via a paid or owned channel) and put the user inside a context of your choosing. They click, install your app (if it’s not installed yet) and land directly into the same context, whether it’s a special offer, signup page, etc. For the user, it’s seamless. For you, it’s a win with significantly higher conversion rates.

Deep links have a storied history as an essential element of attribution. In early 2015, the term and its associated technology barely made sense to even the most savvy technical marketer. Today, it’s a ubiquitous piece of every marketer’s jargon and attribution stack — and for good reason.

Marketers are sometimes confused by the relationship between deep linking and attribution. The bottom line is that deep linking relies on attribution data to properly route the user. Incidentally, this is why you should never work with two separate vendors for attribution and deep linking.

The post Top 5 Reasons Why Mobile Attribution Is a Must-Have In Your Marketing Stack appeared first on AppsFlyer.

Viewing all 869 articles
Browse latest View live