Quantcast
Channel: AppsFlyer
Viewing all 869 articles
Browse latest View live

5 wrong assumptions advertisers have about SKAdNetwork

$
0
0
misconceptions about SKadNetwork AppsFlyer

Apple announced some dynamic changes this past year and pushed a revival of an older attribution channel solution. 

From a two-year-old technology that was barely discussed beforehand, SKAdNetwork has quickly become the hottest topic, driving both hope and concern for advertisers facing the upcoming privacy shifts from Apple. Advertisers are expressing extensive concern about SKAdNetwork; there is uncertainty in how to use it in day-to-day marketing decisions. There are complexities in the setup (aggregate data, conversion values, timers), and uncertainty as to how this ties into the bigger picture from Apple. 

Over the last few months, we have conducted extensive discussions about SKAdNetwork with hundreds of advertisers globally, ranging in fields from gaming to e-commerce, finance, food delivery, and from enterprise and SMBs. Based on these broad discussions, we’ve prepared a list of the most frequent WRONG assumptions existing in the industry about SKAdNetwork.


1.  The timer misconception

Let’s start with timers, extensions, and delays which are a fairly easy misconception to explain. SKAdNetwork has a 24hr timer attached to it, which begins when the SK function is called for the first time (usually upon first app launch). After the 24-hour timer expires, the conversion value is locked in. The good news is, advertisers can still play around with the timer using timer extensions and methods to delay the locking mechanism. 

Timer extension

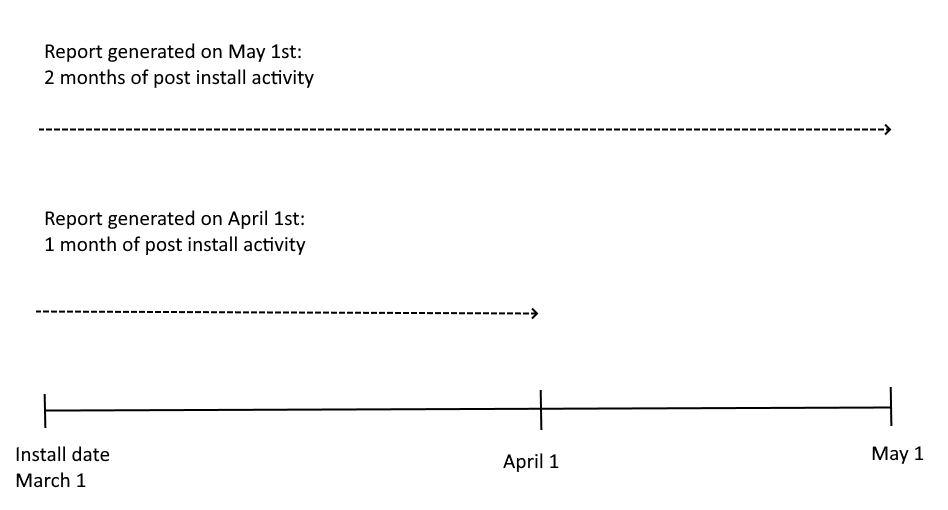
In some cases, advertisers require more than 24 hours of post-install user activity for optimizing campaign effectiveness; one example might be a gaming app, where an advertiser wants to optimize based on day 5 revenue. 

The workaround for timer extensions is simple: if an increase in conversion value is triggered by an app open, the timer will be reset for an additional 24 hours. This function can be carried out numerous times; in theory, you could continue resetting this timer for up to two months. 

The problem with this approach is that it depends on a user launching the app daily (within the 24-hour window). Should they not open the app for one day, the timer will not reset, thus cutting the loop. What’s more, this approach will generate a biased audience, where measurement and optimization are heavily based on the activity of your most engaged users; hardly representative of the entire user base. 

This approach also delays the single SK postback beyond the usual 1-3 days and requires an allocation of bits of the conversion value for the extension mechanism (for example a 7-day delay requires 3 bits, leaving only 3 bits for actual measurable data).

Timer delay

Another solution to the timer limitation is a timer delay, which ensures the measurement and optimization of events occurring down-funnel (such as subscriptions after a 7-day trial or a first in-app purchase). 

You can delay the timer to start only when the initiation of an event occurs. This is done by delaying the first call to registerAppForAdNetworkAttribution and updateConversionValue functions. 

As mentioned above with each of these workarounds there is a tradeoff. On the one hand, delaying the timer prompt ensures measurement of the chosen event, but if the user churns before the event occurs, no postbacks will be sent. In other words, you’ll get 100% coverage of the number of users who performed this event, but you won’t know how many downloaded the app and churned before the event was completed.


2. The 6 bits misconception

Indeed, the conversion value is a very limited resource. A single field of 64 values, that must contain every detail about the user’s journey. Though limited, one field can still decode different KPIs. There isn’t a ‘one size fits all’ approach here, and strategy will differ between apps and KPIs.

There are two methods to approach this: bit splitting and the 64-segment approach. 

Bit splitting

Bit splitting is used to enable the measurement of several KPIs in parallel: revenue, engagement, conversion, retention, and more. Advertisers can allocate different numbers of bits for each KPI, but it’s important to remember that the more bits you split, the less granular the KPI data will be. You could, for example, allocate your bits this way: 3 bits for revenue, 3 bits for level completion. However, this will only grant you 8 levels of granularity per KPI, rather than the 64 you’d have for a single KPI. If you split your bits 6 ways, you’ll only get 2 levels per each KPI (binary). 

The 64-segment approach

The 64-segment approach enables you to measure more than six different in-app events while grading end-users based on segments instead of directly allocating a bit per event. 

This can be done by defining 64 different segments of users. For example, a single bucket can hold the following data: 

  • event1 happened 2-6 times
  • event2 happened more than 10 times
  • total revenue is $20-$60

With this method, you can define an unlimited number of KPIs and events for each segment. The tradeoff with this approach is that you won’t be able to decode back the value to a specific KPI (such as revenue). It also requires you to be extremely careful in validating these 64 segments, making sure they cover the entire range of app users with no duplication between segments. Basically, each user must fall into only one segment, always. 

3. The configuration change misconception

Server-based solutions for SKAdNetwork (like AppsFlyer’s) enable advertisers to change the conversion value configuration in the cloud, where a command will be sent instantaneously to the SDK. This ensures that customer logic is always up-to-date with the desired configurations. 

As with many things in SKAdNetwork, tradeoffs are a key element here. In this case, each configuration change triggers a short period of time in which it’s impossible to determine whether incoming postbacks relate to the old configuration or the new one, creating extra “noise” in the measurement. That’s why we don’t recommend changing strategies too frequently (more than once a week, for example).

We’ve got some good news for you: there’s a workaround for this. It requires you to dedicate 1 of the 6 bits to indicating if the postback relates to the old configuration or the new one. However, as with SKAdNetwork, this introduces another tradeoff: if you want the flexibility to frequently change strategies, you’ll have to compromise on the level of granularity you can measure for your KPIs. 

4. The parallel strategy misconception

There is a way to activate different strategies for different segments of users. The basic requirement is that the parameter that distinguishes the groups will be known both on the client-side (when changing the conversion value) and on the server-side (to know how to decode the value).

A couple of recommended segmentations:

Segmentation based on geo

Measuring different KPIs for different geographical regions. For example, measure revenue for users in France and engagement for users in the US.

Segmentation based on random splitting

By dividing the end-users randomly into A/B groups, you can measure your KPIs in parallel without compromising on granularity. The technicalities of random splitting require that one bit be allocated for the A/B decoding; e.g. bit 1 indicates to the server-side what bits 2-6 are measuring. 

Unfortunately, not all types of group splits are possible; a split based on a media source, for example, can’t be done, as this parameter is still not known on the client-side when changing the conversion value (as attribution data is known only on the server-side).

It’s important to note that random split results must be scaled up, as must postbacks to the networks. This can be carried out automatically by AppsFlyer’s split solution. Make sure your MMP supports this as well.


5. The server events misconception

A cloud-based solution can forward events to the client-side, changing the conversion value accordingly. However, this type of flow has another limitation not presented for client-based events: even if the server-based event was triggered before the SKAdNetwork timer expires, the end-user must reopen the app again before the timer expires in order for that event to affect the conversion value.

For this reason, we recommend sticking with client-generated events wherever possible.

If, despite this limitation, you would like to measure and optimize based on your servers/CRM logic, make sure that your SKAdNetwork framework supports this option. AppsFlyer is proud to be the first server-to-server compatible SKAdNetwork solution.

Gaining opportunity out of a challenge 

There’s no question: SKAdNetwork presents new challenges to marketers. No more “measure everything” and “optimize campaigns based on everything”. That doesn’t mean, however, that this is the end of marketing optimization. There are still plenty of opportunities to measure, optimize, and excel. 

Getting comfortable with all the bits and bytes of the conversion value (pun intended), proper planning, testing, and validating assumptions will ensure you’re making the most out of a less-than-perfect solution. Advertisers can set themselves miles ahead of the competition by taking strong action and working with the best framework to support their measurement needs. Clearing up these 5 misconceptions is a great start, isn’t it?

The post 5 wrong assumptions advertisers have about SKAdNetwork appeared first on AppsFlyer.


5 tips for measuring your mobile ROI

$
0
0
5 tips for measuring your mobile ROI

The one question every business must weigh up when investing in advertising is: what do I get out of it? And from there we can ask ourselves, is it worth it? And is it possible to get even more value from our marketing efforts, and if so, how to go about it?

The key to answering all of these questions is the ability to measure the return on investment (ROI) in your advertising spend (also known as ROAS – return on advertising spend). In this article, we’ll give our top tips for measuring your own mobile marketing ROI, and show just how important accuracy is to achieving profitable returns.


1. Understand your costs & revenues  

It goes without saying that marketing comes at a cost – the investment upon which you are aiming to generate maximum return. But having a full understanding of all the fees and outgoings is vital to determining your ROI. For example, if your marketing efforts involve third party agencies or tools, there are likely to be some fees and costs that need to be factored into your overall numbers. 

It is also necessary of course to have a full understanding of your revenue streams. The app ecosystem is freemium-driven, and free-to-install apps make money through a range of methods. 

In-app purchases (IAPs) allow users to purchase virtual or real-world items in the app, while in-app advertising (IAA) drives revenue from the vast majority of users who do not make an IAP. App subscriptions, such as streaming services or dating apps, generate revenue on a recurring basis. Finally, a section of the app market remains paid-for, with an up-front fee to download and use the app.

Finally, remember to weigh up the balance of cost vs quality. Targeting high-value markets and users comes at a cost, but can generate more revenue. On the other hand, running campaigns in low revenue markets can also be valuable in its own right if the cost of those campaigns is low.


2. Recognise the risk with your data

The first step to solving a problem is acknowledging that the problem exists. ROI is a seemingly simple metric that can be surprisingly elusive – if your ROI data is wrong or incomplete. 

One of the worst outcomes for marketers is not even realising that their data inputs are inaccurate. This is a genuine danger when it comes to mobile marketing: no matter how sophisticated your Business Intelligence team, they may be making poor decisions without realising it due to fraud or misattribution of their data. 

Data accuracy is crucial. “Garbage in, garbage out” is an old adage for anyone looking to make data-driven decisions: if your input is wrong or flawed, your output will suffer as a result. The lasting consequences of this can completely derail any marketing efforts, and with it your app’s performance and your ability to make smart, informed decisions.

Recognising any flaws in your data, or whether it is inaccurate or incomplete, won’t just boost your decision-making ability. It will also drive down wasted spend in your marketing, in turn amplifying your ROI.

Mobile Measurement Partners (MMPs) have deep integrations with the majority of media sources and marketing platforms, making it easy to attribute every install to its source. The robust nature of an MMP platform can greatly enhance your data accuracy, giving you complete trust in your data inputs.


3. Own the data management flow

Advertisers need to have complete control of all their cost data – and relying on an array of other networks, partners or channels to pass data regularly, quickly and securely is nearly impossible in today’s market.

Having the ability to receive data without a lag, and in a consistent format, is vital to making critical decisions. Application Program Interfaces (APIs) that connect directly with a network are one method for ensuring data is accurate and constantly updated in near real-time. Another method is ingestion, which allows advertisers to upload ad spend data from any source, before the attribution provider then standardises it. 

When the data management flow is fully controlled by the advertiser, numbers will be accurate and instantly-updated, and help give you a true reflection of your ROI.


4. Strive for data standardisation

One of the challenges with measuring mobile ROI is the range of inputs and variables that form the data from different cost sources. There is rarely a consistent level of granularity and frequency in the ways different sources report data, with each network having different metrics associated with costs. For example, Twitter reports on tweets, Facebook has page likes, and Snapchat has swipe-ups. This leads to fragmented cost data which – at best – slows down business analytics. At its worst, we’re back to the “garbage in” situation described earlier.

This is where data standardisation has a huge role to play. Marketers must make sure that data sent by ad networks is aligned with their analytics needs. This can be achieved through a consistent, well-defined data structure in naming conventions and macro-parameter matches.


5. Ensure accurate attribution data

Last but not least, accurate attribution data is at the heart of mobile ROI measurement. It’s a technological solution designed to keep data accurate and clean of fraud. When attribution data is wrong or inaccurate, the entire building collapses, and with it any possibility of accurate cost and revenue data.

A high-quality attribution platform brings together connections with thousands of partners, from media companies to analytics platforms. It also has the infrastructure to scale up and down as a marketer’s needs require, without any drop-off in the accuracy and efficiency of the attribution itself.

An attribution platform requires a lot of technological expertise and experience to build – but provides immense value when it comes to accurately measuring ROI. It gives you complete control of your cost data, and empowers you to make fast, critical decisions while reducing the risk of mistakes.


Conclusion

Measuring your mobile ROI is a complex, ever-shifting challenge with a huge range of variables to track and optimise in near real-time. Marketers need to plan for what to measure, and also recognise limitations in their own data.

Ensuring accurate attribution data is crucial and can be handled by platforms like MMPs. MMPs and their products can overcome many of the challenges presented above, at a scale to suit any business. Discover more about understanding your true mobile ROI, and the importance of getting a complete view of your marketing spend, with AppsFlyer.


The post 5 tips for measuring your mobile ROI appeared first on AppsFlyer.

Upgraded Flexibility and In-app Validation Rules Introduced

$
0
0
mobile ad fraud validation rules

On many levels we hand over our control of everyday activities to technology – trusting it to do the work – making both our personal and professional lives easier in the process.

However, giving up control so easily shouldn’t come to play. A good technological solution helps in easing processes that may be too complicated, especially those that are daily activities, but an excellent solution provides flexibility to better control the quality of performance.

If we take it a step further an outstanding product will combine all the above and add customization abilities. Thus, creating custom made experiences, and further serving our unique edge cases. 

AppsFlyer’s massive upgrade to its Validation Rules serves exactly this purpose.

A unique solution that allows app marketers to set custom in-app fraud validation rules. 

The first to offer marketers such in-depth control over their campaigns

This feature is accompanied by an enhanced combination of flexibility and customization to your campaigns’ performance. Providing you with unparalleled control all the way from basic campaign targeting to sophisticated in-app fraud cases.


Enforcing your orders

When heading into a new campaign or partnership, your IO is meant to outline the general boundaries, and reflect your expectations from each media partner or agency. 

But how can you enforce these expectations? 

These are not just questions on  meeting business goals based on specified deal targeting or meeting technical requirements (OS version), but what should be weighed it the possible  legal ramifications.  Some app types could be illegal in certain regions (i.e. gambling and casino apps).

AppsFlyer’s Validation Rules set clear definitions of what is accepted as legitimate activity and more importantly, what isn’t.


From campaign targeting to fraud protection 

The ability to set and customize your own rules and boundaries around your campaign is fundamental to maintaining a healthy campaign. 

Inputting your business logic into a campaign’s set-up informs your media partners that you mean business, and that the IOs that both sides agreed upon are to be upheld. This further enforces basic campaign elements such as OS, GEO or user persona.

However, that’s merely the foundation of your campaign. Mistakes occur even from the best publishers and media partners. Enforcing these rules are key to avoiding such mistakes and in avoidance to pay for anything that falls outside of your campaign goals.

The true value in operating your very own rule structure is the ability to outsmart those who intentionally seek to cause harm through malicious and nefarious means. Anti-fraud validation rules are another vantage point in the ongoing game against fraud

Protect360 multi-layered fraud protection

Protect360 multi-layered fraud protection

An integral part of Protect360’s multi-layered fraud protection, customized rules, is your business strategy aimed to catch fraudsters, even the most sophisticated ones.  

No fraudster has  insight into your KPIs and benchmarks or can know your business as well as you. Applying your knowledge of CTIT distributions, time frames per actions, or any other unique characteristics should be formulated into a set of rules to eliminate fraudsters looking to manipulate or mimic your user behavior.


Connecting the dots

AppsFlyer recently announced its latest addition to Protect360’s fraud protection suite – a dedicated in-app and CPA fraud dashboard

As the first MMP to offer thorough insight into sophisticated in-app fraudulent activity, we went further to break the misconception that CPA campaigns act as a protection from fraud, by making in-app fraud data visible and accessible. 

Today we share our next step, as we introduce the unique ability of setting dedicated validation rules for your in-app activity. Giving you the ability to control fraud activity beyond the point of install attribution. 

You can now define specific triggers to indicate cases of user-fraud and non-attribution manipulations – ones that can only be customized based on your app experience and business logic.

These can be easily configured by setting rules and benchmarks for irrational behavior and “can’t happen” events. A great example is a suspiciously short time frame between 2 events – potentially signaling resource draining bots. Another example is premature events like paying for a product in their shopping cart prior to registering to the app.


Flexible protection

The ability to translate measurable data into actionable insights is crucial for modern online campaigns, and for specified audience requirements and segmentations. 

The more accurate you are, the more profitable your campaign will be.

The more control you have over rules and specific edge cases, the more accurate you can become.

Don’t compromise on accuracy or customization when it comes to your marketing activity.

Take back control over your campaigns with AppsFlyer’s new Validation Rules.

The post Upgraded Flexibility and In-app Validation Rules Introduced appeared first on AppsFlyer.

Top 5 data trends that shaped mobile app marketing in 2020

$
0
0
top trends mobile app marketing 2020

‘The coronavirus pandemic’ is the first set of words in AppsFlyer’s 4th annual top 5 trends of the year post, and for good reason.

The pandemic has led to more home time and unfortunately more alone time, as people all over the world took to their mobile devices to meet a wide variety of needs: emotional (gaming, fitness, social networking, streaming, shopping…) and functional (finance, business, food delivery, and once again shopping…).

We’ve seen the shift to digital in recent years, but then came COVID-19 and greatly accelerated existing trends. Among others, the adoption of mobile apps and the understanding among brands that this channel should be at the forefront of their presence.

2020 was also the year Apple introduced dramatic privacy-related changes as part of its iOS 14 release. The announcement sent shockwaves across the industry, prompting Apple to postpone its enforcement to “early 2021”. What impact did the impending shake up have on 2020 campaigns? Find out ahead.

Our data sample covers 48 billion installs in 2020 of over 30,000 apps with a minimum of 5,000 installs per month.

Click to explore (and back in browser to go back):

1) App downloads climbed 33% as UA spend hit $74.6 billion

2) Cost per install spiked 30% post-lockdown leading to higher spend despite NOI drop

3) App revenue on the rise across revenue streams: IAP, IAA, and subscriptions

4) Massive organic demand for non-gaming apps, while gaming apps leaped with UA

5) Almost 1 in 10 non-gaming app installs had a preceding visit to the brand’s website

BONUS! Privacy measures in iOS 14 have yet to impact campaigns (focus on yet…)

The million dollar question: What will 2021 look like? 


1) App downloads climbed 33% as UA spend hit $74.6 billion

Mobile app marketers spent $74.6 billion globally in 2020 to drive users to install mobile apps. The figure is slightly less than the $76.2 billion we predicted in February, but still represents a significant 30% increase compared to 2019.

A platform breakdown has Android at $48.5 billion and iOS at $26 billion. Apple’s OS commands 35% of spend despite its 18% market share of non-organic installs because its cost per install is more than double that of Android.

Despite the surge in demand for mobile apps, the high cost of media prevented marketers from further scaling, as budgets continued to shift to remarketing (see trend #2 for more).

The number of app downloads increased by 33% in 2020, up 25% compared to 2019. We can see that both pure consumer intent and marketing efforts contributed to this leap.

But a closer look shows opposite trends, despite the impressive growth on both ends. While the growth rate of marketing-driven installs (non-organic installs or NOI) dropped by 27% this year, pure consumer intent — or organic installs — jumped by almost 60%.

We can also see that remarketing adoption continues to rise. This trend is driven by 1) the significant increase in the cost of installs, compared to the far more affordable price of remarketing media, and 2) the focus on cultivating loyalty amid retention struggles.    

In 2019, remarketing exploded among mobile apps, so keeping up with that pace is unrealistic, in spite of the above. Although growth was cut by half in 2020, it remained extremely robust at 82%. 

A deep dive into this unusual year demonstrates just how significant the March-April lockdown period was, especially for marketers, with double the growth rate compared to Aug-Oct (in other words, NOI grew 57% in March-April 2020 compared to March-April 2019, while growth in Aug-Oct 2020 increased by “only” 29%).


2) Cost per install spiked 30% post-lockdown leading to higher spend despite drop in NOI

Another view of 2020 trends showed just how much the cost of media impacted marketing decisions.

Early lockdowns in March-April led marketers to aggressively promote their apps amid extremely high demand, particularly among the quick-to-react gaming apps. The fact that CPI was at a low point — with traditional big brands holding back on marketing amid the uncertainty at the time — helped apps scale.

But starting in May as lockdowns were eased in many markets and anxiety lessened to some extent, big brands returned. Furthermore, many other brands who had started shifting to digital, realized that they needed to move much faster. As previously mentioned, the pandemic was an accelerator of many processes.

The end result: the competition for user attention accelerated and with it cost per install jumped 30% between April and November — a trend that was seen in both SRNs (self-reporting networks) and non-SRNs. Many app marketers tend to look at the app ecosystem, and even their own category’s competitors. But the reality is that they compete with anyone who advertises on a given platform.

Indeed, the number of non-organic installs also dropped as the cost of media started to climb (there was also a decline in pure consumer intent after heavy activity during lockdown as the trend line in organic is similar: dropping but not as much as NOI). In total, NOI was down 22% from the April peak to November.

As UA dropped, remarketing consistently climbed with lower prices and a large number of new users acquired early on who could be remarketed. All in all, the number of app remarketing conversions (counted as users who open an app after clicking on a remarketing promotion) leaped 70% from March to November.

Another indication of just how significant the cost increase was can be seen in the UA spend trend. Despite the decline in NOI, budgets increased by 25% in Oct-Nov (compared to June). In most of H2, app marketers were spending more money and getting fewer users.


3) App revenue on the rise across revenue streams: IAP, IAA, and subscriptions

The massive boost in the number of new app users in 2021 has led to an uplift across revenue streams.

When it comes to the largest revenue stream — in-app purchases (IAP) — we can see that despite overall revenue growth, gaming and non-gaming showed different patterns early on in lockdown (and therefore were presented separately).

Non-gaming apps, mainly the large traditional brands, reduced or ceased marketing spend amid the uncertainty; also, most people were only looking to purchase essential goods during the first lockdown (in some countries, only businesses that sold essential goods were open). After lockdown, the new normal set in and that was when revenue of non-gaming apps in multiple categories started to climb. By November, it had surged 35%.

Gaming IAPs, on the other hand, started to rise early as gaming app marketers employed aggressive UA strategies during lockdown leading many new players to install gaming apps. Games were then able to monetize players who remained loyal in the following months through in-app purchases.

In-app advertising (IAA) for gaming apps (the sample size was not statistically significant for non-gaming apps) also made strides throughout the year, peaking during lockdown, and then climbing 30% since July.

Ad revenue is mostly related to CPI and app sessions. Despite the drop in the number of sessions since the lockdown surge, the rise in CPI increased at a greater rate, and with it CPMs for publishers.

Subscription revenue started to climb in March and by April had already jumped by 40% compared to February. Clearly, while at home, more people streamed more music and video content, while also subscribing to other services like Health & Fitness, Education and even Dating apps. In fact, the average app running subscriptions increased its revenue in 2020 by 56%, with the large players almost doubling their income.


4) Massive organic demand for non-gaming apps, while gaming apps surged with UA

A comparison of the different app categories, sorted by year-over-year growth of organic installs also tells the story of the pandemic. 

People around the world used apps to socialize (Social) while physically away from each other, used various tools and utilities while working from home (Business, Utilities), shopped, watched videos (Video Players, Entertainment), worked out and meditated (Health & Fitness), educate (when school was out) and of course play games. Regrettably, there was negative demand for Travel apps, although it has picked up in the last couple of months.

We can see that some verticals were looking to capture heightened consumer intent and doubled down on spend (e.g. Education, Gaming and Video Players), while others grew largely due to organic demand (e.g. Lifestyle, Health & Fitness, Shopping) that was not matched by marketing spend (e.g. Lifestyle, Health & Fitness, Shopping, Utilities) — perhaps a missed growth opportunity, or a desire to minimize cannibalization of organic traffic. 

A look at the top growing markets by non-organic installs — sorted among the largest 30 markets by number of total installs — shows significant growth opportunities across the globe: from the Middle East, Asia, Africa and Latin America. 

Markets with significantly higher organic than non-organic growth are a potential growth opportunity: these include Japan, Philippines, Iraq, Saudi Arabia and Indonesia. Even the world’s most popular app market, the United States, had 75% higher organic growth. 


5) Almost 1 in 10 non-gaming installs had a preceding visit to the brand’s website

The reality is that, in 2020, there still remains a significant divide between user behavior and marketing measurement.

On one hand, there are the end users whose conversion journeys are becoming increasingly complex, involving multiple devices and touchpoints. On the other hand, there are the marketers who measure user actions across different channels and devices, but do so in silo from one another.

But guess what, an analysis of 45 apps (mainly eCommerce, Finance, Media & Entertainment, and Food & Drink — all of which were live throughout the measured time frame) found that the number of app installs with a preceding visit to the brand’s website has almost doubled this year. In fact, in almost 1 in 10 installs, the web was part of the user journey.

This is big news for marketers. It means that they can also acquire users on the web where the cost of media is cheaper, and drive them to the app via owned media promotions (website button, email etc.)

Also, if there’s one thing that’s common among marketers, and rightfully so, is the desire to get credited for driving more demand. After all, it’s all marketing in some way, shape or form is it not? 


BONUS! Privacy measures in iOS 14 have yet to impact campaigns (focus on yet…)

In June, Apple rattled the app marketing ecosystem with its announcement of a new privacy-driven mechanism to be implemented as part of iOS 14. The AppTrackingTransparency framework (ATT) required users to actively opt-in to IDFA collection when using the app

In practice, such a mechanism would de-facto eliminate the ability to use the IDFA for measurement and attribution. In October, we found that 99% of users would NOT opt-in when asked to be tracked.

Apple’s decision to postpone the required change to “early” 2021 led to a collective sigh of relief.

But while things shook under the surface, the fact that apps were not required to implement the changes allowed marketers to continue as usual. Indeed, the data below shows that, for the time being, the upcoming release has yet to shift budgeting decisions — neither for UA, nor for remarketing.

Things will look different in the ‘Top 5 trends of 2021’ post. After all, advertisers spent $26 billion on iOS UA alone in 2020 (see trend #1 for more).


The million dollar question: What will 2021 look like?

The truth is that predictions are never easy, but 2021 is truly a difficult one. COVID-19 will likely continue to impact social behavior at least in the coming months even if a vaccine is hopefully approved and distribution begins. That means continued economic uncertainty for many households and businesses, which can affect consumer spend.

Having said that, we’ve seen the rise of digital during social distancing, which continues to present an economic opportunity for mobile apps. Even if this crisis will [hopefully!] come to an end in 2021, digital acceleration is a fact as scores of people across the globe have already adopted mobile apps in 2021 as part of their daily routine.

Beyond the economic conditions, the expected release of the ATT framework in iOS 14 will have a major effect on the app marketing space, and on measurement in particular.

In addition to several significant unknowns that Apple has yet to finalize or clarify, marketers also face many uncertainties: how will measurement actually work, what will be the impact on the cost of media, what will the media mix look like, what will be the future of remarketing (which we’ve seen surge in the last couple of years), how will machine learning-driven ad platforms adapt, to name just a few.

In the absence of IDFA, more focus will be placed on various other forms of measurement, especially aggregated measurement, in addition to incrementality, probabilistic modelling, and the expansion of web-to-app attribution models.

Ultimately, change drives innovation. Measurement will adapt to a new privacy-centric reality that eliminates the bad of personalized advertising and keeps the good to allow data-driven performance marketing to continue to thrive.


Subscribe to AppsFlyer content

The latest mobile marketing tips trends delivered to your inbox.

The post Top 5 data trends that shaped mobile app marketing in 2020 appeared first on AppsFlyer.

Xpend: 6 High impact product updates

$
0
0
Xpend feature updates 2020

By now, you’ve probably aware of AppsFlyer announcing the next-generation cost aggregation product, Xpend. Since our launch in September, we are thrilled to continue and release even more features and capabilities right in time for the busy holiday season.

Xpend solves one of the biggest challenges for marketers today when addressing data aggregation and normalization; providing an accurate, complete, and actionable solution.


Standardize cost data with Cost ETL

As part of Xpend’s release, we are now offering our customers a way to extract cost data to their BI systems via an AWS S3 bucket. This allows advertisers to receive cost data at the most granular level and at scale.

While cost data is supported on various dashboards and reports, some advertisers prefer to enrich their cost data at the most granular level in-house and manage independently to manipulate and analyze cost data based on their business needs. This data can include insights on campaign bids, video view metrics, designated market area (DMA), clicks and impressions as reported by the networks. 

Xpend Cost ETL

Cost ETL configuration page


Google cost integration just got better

With the Google Ads API, Ad Spend is now fully supported for both user acquisition and retargeting to ensure end-to-end visibility of advertisers’ campaigns. In addition, Google cost data is now supported on all campaigns at the country, ad group, and channel levels.

As an advertiser, you may be running campaigns on YouTube, Google Display Network, and search channels, where you may notice greater success on one of these channels. This view allows advertisers to easily optimize their budget accordingly geared to the best performing channel.

In addition, advertisers can now view retargeting cost data for Google within the cohort dashboard and cohort report under unified cohort type.

Xpend Cohort Report

AppsFlyer’s Cohort dashboard

With Google’s announcement of Google App Engagement Campaign (UAE) this support is more important than ever for mobile app advertisers, into which we greatly encourage you to dive-in and take a deeper look.


Even more API Integrations

Xpend already supports up to 65 new cost API integrations, adding Criteo, CrossInstall, Ad Action Interactive, Global Wide Media, Youappi Retargeting, Dataset, Pinsight, Appgrowth, Point2Web, KPM BRO, and Domobc DSP to the list. These integrations are all supported at the deepest granularity available.

Enjoying all of these integrations via the API means less overhead for our advertisers with more time to focus on optimizing campaigns instead.


Take full control of your cost API integrations

With our brand new cost integration status page, advertisers can gain a centralized view of their cost integration statuses across all of their apps and easily correct any errors with a single click. The top bar of the page will always provide advertisers with the statuses of their integration, including active or inactive integrations and those that require action. They can even reauthenticate their accounts directly from within the page.

As an advertiser, your priority is to ensure that you’re making decisions based on the most accurate data. If even one of your API integrations is failing, it is plausible that your data is not the most up-to-date, which can result in loss of money reflected by making the wrong decisions.

The new page removes friction by showing what integrations require your action and proposing to you the necessary steps needed to correct and minimize the impact. 


Additional support for cost by Site ID

Cost by Site ID is now supported for 29 networks, including recently: Unity, Digital Turbine, Fyber, Moloco, Aura, Adjoe, Appreciate Offers, JetFuel, Persona.ly, and AdGate Media.

When optimizing campaigns Site ID is a critical component across the industry. Advertisers may want to optimize by Site ID for many reasons.

Xpend Overview dashboard SITE ID

Cost ETL configuration page

For example, let’s Imagine, a health app where articles related to health are displayed within a news channel, and seemingly those articles are performing best for that app.

Most networks provide advertisers with insight on the Site ID level so that they can understand which source performs best for their app, and additionally invest there. Alternatively, they may want to stop paying for sources that are buying low-quality users or are not resonating with that app’s audience.


Ingestion Full Scheme

With Ad Spend Ingestion, advertisers and partners on behalf of their advertisers can upload spend data for sources that do not support an API connection; thereby, providing a truly full view of their spend data across their entire marketing program. Additionally, Ad Spend Ingestion can be used as a mechanism to correct wrongful cost data or apply any discounted or revised cost data retroactively.

Ingestion full scheme enables both partners and advertisers to ingest cost data over the entire campaign hierarchy and at the following dimensions: Country, Site ID, Channel, and Keywords.

This allows advertisers to optimize campaigns at the most granular and accurate levels. Think of uploading all of your cost data in one easy swoop.

More to come

Xpend is now a premium product at AppsFlyer and as such, we are committed to providing the highest value for our customers so that they can rely on their cost and ROI calculations and focus on what really matters – optimization.

The post Xpend: 6 High impact product updates appeared first on AppsFlyer.

AppsFlyer & Facebook: Introducing advertiser-centric SKAdNetwork measurement

$
0
0
Facebook AppsFlyer SKAdNetwork Solution iOS 14

Since the introduction of SKAdNetwork as the main deterministic attribution solution for iOS 14, advertisers have expressed concern about the increased development costs and limitations. Initially it appeared as though SKAdNetwork would require advertisers to invest extensive resources into connecting with multiple publishers and ad networks.

Uncertainty also arose around the question of the conversion value: who should own it, where the conversion value schema should be configured, and how exactly it is controlled. 

Today, we’re excited to announce an interoperable SKAdNetwork integration for brands advertising on Facebook, as announced on Facebook’s iOS 14 blog post. Advertisers can now measure Facebook ad campaigns via SKAdNetwork with AppsFlyer, utilizing the functionalities they already have in place. This supports AppsFlyer’s solution as a one-stop-shop for conversion value configuration, enabling advertisers to optimize their ad campaigns for all networks in one single, self-serve dashboard. This integration with Facebook for SKAdNetwork results in minimum disruption and development costs for advertisers.

AppsFlyer’s solution with Facebook has two major benefits:

  1. A single SDK – advertisers can continue using only the AppsFlyer SDK to run and optimize Facebook mobile ads, including ads using App Event Optimization and Value Optimization. This means lower development costs and virtually no setup for AppsFlyer customers.
  2. Single source of truth for SKAdNetwork mapping – the conversion value schema can easily be set up and optimized in AppsFlyer’s fully operational, flexible SKAdNetwork configuration page; which is then shared with Facebook and all partners integrated with AppsFlyer’s SKAdNetwork solution (see below).

AppsFlyer Facebook SKAdnetwork solution flowchart

Click to enlarge

The conversion value for Facebook can be managed easily from AppsFlyer’s SKAdNetwork settings or in Facebook. Changes made to measurement in either location will be reflected in both places. 


AppsFlyer and SKAdNetwork: the key to intelligent decision making

AppsFlyer’s SKAdNetwork solution ensures that the conversion value is consistently applied across platforms, crucial for accurate measurement. With so many complex partner integrations running simultaneously, advertisers not working with an MMP will not be able to rely on any single source of truth for conversion mapping. AppsFlyer serves as a central configuration point that all networks can rely on for optimization. Today we’re proud to have Facebook as a major partner in this vision.

Facebook is part of a growing list of respected global partners who have already started integrating with AppsFlyer’s SKAdNetwork solution, including:
– Snap
– Twitter
– ironSource
– Unity
– Vungle
– Tapjoy
– Remerge
And over 40 others.

AppsFlyer and Facebook have worked closely together over the last 8 years to deliver the most robust solutions for advertisers, from basic attribution to advanced ad revenue measurement. This is another stone on the path to continuously delivering the top measurement solutions for the biggest brands worldwide.

The post AppsFlyer & Facebook: Introducing advertiser-centric SKAdNetwork measurement appeared first on AppsFlyer.

[Data insights] What attribution data is lost with SKAdNetwork?

$
0
0
SKAdNetwork attribution data study AppsFlyer

Since Apple’s announcement in late June, developers have been speculating about how iOS 14—and namely, SKAdNetwork—will impact their abilities to conduct accurate measurement and optimization.

As things stand, SKAdNetwork will likely be the main source of deterministic attribution available to advertisers for iOS. As an attribution solution, SKAdNetwork holds many benefits; perhaps, most importantly, the inherent privacy-first approach of the product. 

The limitations of SKAdNetwork, however, are not to be ignored. They have drawn a lot of concern among developers, leaving a lot of unanswered questions; one of the biggest being how developers were going to manage the overhead of supporting this API. The other question, perhaps more concerning, was how mobile measurement would be impacted by the limitations that are an inherent part of SKAdNetwork.To help advertisers prepare for the planned changes in iOS 14, AppsFlyer released the SKAdNetwork simulation dashboard back in early September. This dashboard simulated the very real effects SKAdNetwork has on attribution data.

With this extensive infrastructure in place, we were able to answer the question, “how far-reaching are SKAdNetwork’s limitations, really?” How badly will data actually be affected, when run through the SKAdNetwork sieve?

What we expected to find

To answer these questions, we ran an extensive analysis of SKAdNetwork data.
Our working hypothesis was that attribution would be impacted, just by the nature of what SKAdNetwork covers and what it doesn’t:

  • Only app-to-app flows and direct click-to-install flows
  • Only events that occur up to 24 hours post-install (unless timer extensions are put in place, and they have their own trade offs)
  • No web-to-app
  • No re-engagement
  • No measurement of view-through and deferred click-through
  • No ROI measurement

For these reasons, we anticipated both a gap in the total numbers of measured installs, in-apps and revenue, as well as potential discrepancies in attribution sourcing. In other words, we anticipated that non-organic installs and in-app eventsthat advertisers pay media sources for—would be falsely attributed by SKAdNetwork as organic. 

What we weren’t entirely sure of ahead of the analysis, was the extent of the impact, as well as whether or how the impact would differ among different app categories.


Comparing actual data to SKAdNetwork data

Our analysis was conducted by analyzing non organic installs, revenue and in-app event data from all major App Store categories: Finance & Fintech, Games, Health & Lifestyle, Media & Entertainment, Music, News/Magazines/Catalogs, Photo & Video, Social, Networking, Utilities and e-Commerce/Retail . A sample size of roughly 30 apps from each category was included in the analysis; all apps measured have a minimum of 500 daily installs. The data included was measured over a 30-day period and is LTV-based.

We investigated the data from two angles:

  1. What it looks like now
  2. What it will look like with SKAdNetwork – the same data, run through an SKAdNetwork “filter”, based on the limitations mentioned above

We compared the two data sets to see how much of the non-organic data is actually captured by SKAdNetwork.

What we uncovered

Unsurprisingly, SKAdNetwork considerably impacts the accuracy of attribution data in regards to non-organic activity data. In short, roughly 34% of all non-organic activity slips through the sieve and is misattributed as organic. Some categories are more severely affected than others (Photo & Video and Media & Entertainment are the hardest hit across the board), but all categories are impacted by this.

Here are the key findings regarding SKAdNetwork’s effect on the data:  

  • On average, 32% of non-organic installs were wrongly categorized as organic installs by SKAdNetwork.
  • The app categories hardest hit by misattribution (non-organic traffic falsely attributed as organic) were the Photo & Video category, (44.6% of NOIs misattributed) and Media & Entertainment (40.5% NOIs misattributed).
  • The category least impacted by NOI misattribution was Gaming, where “only” 21.8% of NOIs were misattributed as organic.
  • On average, SKAdNetwork captures around 64% of revenue* driven by non-organic installs.
  • The app categories that lost the most non-organic revenue data were Finance & Fintech (only 52.7% revenue captured), Photo & Video (50.1% revenue captured) and Shopping (51.2% of revenue captured)

Needless to say, this isn’t a gap that can be ignored. Advertisers need to know that marketing dollars spent on ads are not disappearing into a data void.


Why SKAdNetwork isn’t the whole answer

While SKAdNetwork does provide a very critical part of the solution for ad attribution on iOS apps, it does not provide 100% coverage. With such gaps between what the data advertisers need and what they will be getting in reality, SKAdNetwork still has a lot of catching up to do.

SKAdNetwork isn’t the solution, but it is certainly one part of it. It is a deterministic attribution method, after all, and there is no need to throw out the baby with the bath water.

The key here is the approach; SKAdNetwork needs to be addressed as part of a whole. Advertisers need more than SKAdNetwork to be able to truly measure the performance of their marketing efforts, and that’s where solutions like probabilistic modeling and web-campaign-to-app come into play. Each has different purposes and ticks a different box, but all together they provide a complete picture of performance and can help advertisers set advertisers up for success.


Learn more about AppsFlyer’s iOS 14 solution


*This revenue drop refers to attribution only, and is not due to the limited capability of measuring LTV with SKAdNetwork.

The post [Data insights] What attribution data is lost with SKAdNetwork? appeared first on AppsFlyer.

5 ways to analyze app campaigns using marketing analytics

$
0
0
5 ways to analyze app campaigns using marketing analytics


Understanding your marketing data can be a confusing business. The graphs may look engaging, but if you don’t know how to differentiate between them they lose their inherent value. 

Managing and studying each metric can be done via the marketing analytics reports which allow you to deconstruct the data, highlighting trends and delivering insights.  

Applying these insights to better optimize app campaigns is key to success. 

At least 99% of apps in the app stores are free to install. In this reality, even if you successfully drive app downloads, you are still yet to generate any revenue. Therefore your campaigns must be optimized to attract loyal and engaged users who will ultimately drive revenue. 

Marketing analytics reports use the data to highlight which media channels attract the highest value users — those whom the apps can monetize. 

In this blog we will review 5 different reports and see how each of them plays a key role in optimizing your app campaign. 


1. LTV report

An LTV or lifetime value report offers marketers data about all events performed in the app during a set time frame since installing the app.

The use of the word lifetime can be confusing, so to be precise lifetime means to date (or to the day the report was generated). An LTV report based on users who installed during March 1st and generated on April 1st covers a month of post-install data; if it had been generated on May 1st, it would cover two months of data.

In an ecosystem dominated by the freemium model, the LTV report provides vital information about the real value of users across a variety of metrics, whether engagement-related or revenue-related.

It is important to separate between LTV, which is essentially the revenue generated by a user in a given time frame, and an LTV report which covers a variety of metrics that measure post-install behavior.

LTV reports will therefore help you compare the quality of users from different channels, media sources, campaigns, and even creative variations, and optimize accordingly.

So, for example, media source A delivers a higher number of installs, but media source B delivers fewer users who spend more. In such a scenario, the marketer should increase the budget for media source B, and consider decreasing spend on media source A (assuming it is able to generate some scale and is profitable).

In addition, it offers valuable information about different groups of users so you can compare their post-install value, and better understand what characterizes each group — when they installed, from which region, and what did it cost to acquire them.

In this case, you could compare the revenue generated after 30 days by users who installed on March 1st vs. users who installed on April 1st.

Armed with this data, you can quickly find out which users from which sources deliver real value and equally important which don’t. It is the basis of decision-making and allows you to optimize your campaigns accordingly.

Let’s look at an example of an app’s data set and try to understand where the marketer is succeeding in their campaign, and where some optimization is needed.

LTV report example

The above LTV report of users who installed during the first week of November shows that, after 30 days, Media Source 3 delivered users with the highest overall loyal user to install rate. Media Source 1, on the other hand, drove more than double the installs but had a lower loyal user rate. 

The marketer can then decide whether to allocate more resources to Media Source 3 (if they focus on loyal user rate), or Media Source 1 if they want increased scale but a slightly lower loyal user rate.

Subscribe to AppsFlyer content

The latest mobile marketing tips & trends delivered to your inbox.

2. Activity report

Activity reports measure events performed by active app users within a given date range regardless of their install date. Activity reports are important because they can help measure the effectiveness of a channel or media source within a specific time frame. 

They can be useful for analyzing performance around a specific highlight in the calendar such as Black Friday or the holiday season. You can also use activity data to see how much revenue was generated by all app users in February, and then compare it to February of last year, or to January.

Of course, Activity reports deliver an alternative view of the data, but nevertheless will highlight important trends. You can then use these trends to optimize your app campaigns by assigning more or less budget to a specific media source. The next time you have a similar event or date range you can take these insights and apply them to your app campaign, optimizing your spend and delivering improved results. 

Activity report dashboard

Here we have taken data from the same app and are now looking at it from the prism of the Activity report. Looking at the number of activity sessions, there is a new Media Source (5) that is delivering the highest number of activity sessions during this time frame. It is worth noting that they were not in the top five number of loyal users in the LTV report, but do feature highly in the Activity report.

However, Media Source 5 has a low conversion rate and a high average CPI (Cost Per Install). So, while the data shows us a high level of activity it also shows us that there is a low conversion rate, and so it appears that there is room for improvement and optimization of Media Source 5. Looking again at Media Source 3, we again see an above average conversion rate and CPI.

The Activity report can also show us how a selected KPI performs over the same time period. In this example, we can see that on 26/11 there was a drop in usage in terms of DAU (Daily Active Users). A marketer can investigate if there was a reason for this drop in usage.

Activity report dashboard DAU

3. Retention report

We mentioned earlier that having a user download and install is just step one. However, the real work is still ahead of you. Retention is all about ensuring that a user actively engages with your app post-install. Securing loyalty is a huge challenge because of fierce competition (there are millions of other apps to compete with) and increasingly high user expectations.

Retention is crucial to optimizing app campaigns as it is the basis of monetization. Retention reports pinpoint the moment when users start to drop off, and inform you when it’s important to optimize, or re-engage. The retention rate is calculated by dividing the number of users who were active on a specific day/ week since the install day/ week by the total number of users who launched the app for the first time during the selected date range.

Retention rate report formula

Retention reports will also show how different channels perform over time and what the overall retention rate is. So Network A may have a higher number of users but Network B may retain a higher percentage of users over time. 

These insights help you understand which media sources deliver users who will keep coming back to your app, and optimize your app campaigns at the right moment to re-engage users when they would otherwise drop off. 

Retention report dashboard

Here is another way of looking at the same data which shows us an interesting twist. In the LTV report, Media Source 4 had the 2nd lowest loyal user to install ratio (loyal users are counted when a user completes 3 app sessions). However, from the Retention report we can see that over the course of the first 10 days, it was consistently the media source with the highest retention rate.

This may go some way to explaining why this app marketer is deciding to invest in this media source — which delivers users with the highest likelihood to open the app on day 10 (even if the ratio of highly engaged users is low — probably the result of more play early on, but faster churn).


4. Cohort report

Cohort reports take a subgroup of users who share a common characteristic, for example, those who installed on the same day from the same country. By applying specific parameters, filters, or dimensions to the data you are able to slice and dice it differently to add context.

By adding context to the data you are able to drown out some of the background noise and show a different trend which may not have been noticeable when the data was broader. You can identify areas of success and failure in your app campaigns and optimize accordingly. The cohort report may show which channel brings in more engaged users in a certain time frame, or from a specific location which would have otherwise gone unnoticed. 

It is important to note that in cohort analysis, the figures are cumulative, and therefore the lines don’t drop.

For the purposes of this report we have removed the organic channel from the graph. So, whereas previously we have focused on Media Source 3 having the highest rate of loyal users, we can see here that Media Source 1 delivers the highest revenues, although the rate of revenue generated by this cohort over time is similar across media sources. 

Cohort report dashboard

If we change the cohort report to look at KPIs by install date we see the results take a different shape. We can see from this that after three days the most revenue, by far, was generated by those who installed via Media Source 2 on November 22nd. Diving deeper into this day can provide valuable information regarding success factors (e.g. creative, campaign time of day. etc.)

Cohort report dashboard KPIs

The other trend that stands out is that, insofar as we can tell, the waves indicate that users who installed on a Monday or Tuesday were the most valuable to the app. Having this information can help you optimize your app campaign by knowing that Mondays and Tuesdays are the most lucrative and therefore more budget should be invested in your campaigns on those days.  

In short, cohort analysis adds a different perspective to the data highlighting a trend that may have otherwise gone unnoticed. 


5. Remarketing report

Remarketing (also known as retargeting) is a key part of any app marketer’s toolbox. It aims to re-engage with existing app users across paid and owned channels to help drive loyalty. With most apps losing 95% of their users within the first 30 days, remarketing becomes vitally important in the fight against churn, as its cost is much lower than the cost of user acquisition

Remarketing report dashboard

For whatever reason, despite not registering impressions or clicks, Media Sources 3 and 4 still managed to generate additional revenue as a result of their remarketing campaigns. Media Source 2 has invested heavily in their remarketing campaign and achieved a high conversion rate, but a low ARPU (average revenue per user)

In this example, Media Source 4 is in a league of its own as far as revenue per user goes, so it would be wise to consider allocating more budget to this network.


LTV vs Activity reports

It is important to remember, that with the exception of Activity reports, all Marketing Analytics reports are based on LTV data. That is to say, they all use data related to when the user installed and then view what happened post conversion up to a date of their choosing. Activity reports differ in that they are only interested in the total activity for a specific day/ week/ month etc, regardless of when a user converted 

To explain this we can use the train analogy. Imagine you are on a railway platform watching a train pass by. In a single moment you can see only the activities performed by all the passengers at the same time. This is activity data. 

Now imagine you’re inside one of the railroad cars. You can now see all of the activity and interactions performed by the people who boarded the same carriage at the same time as you. This is lifetime value data.  


The same data through different prisms

By exploring the same data through different prisms we are able to see that each report has its own inherent value to the marketer in helping to pin-point trends and deliver insights. Combining the collection of reports gives a broad, but also granular view of which app campaigns worked and which didn’t depending on which KPIs you want to focus on. 

The bottom line: Marketing analytics reports for app marketers are must-have, powerful tools that turn data into insights, and ultimately into the right investment and optimization decisions.   


The post 5 ways to analyze app campaigns using marketing analytics appeared first on AppsFlyer.


2020: An exercise in mastering change

$
0
0
2020: An exercise in mastering change - AppsFlyer

“Intelligence is the ability to adapt to change”

Stephen Hawking


2020 gave us the opportunity to practice one of the most important lessons in life and in business – mastering change. Individually, as an organization, and as a society. 

To master anything you must practice it. And boy have we been practicing change for the last decade. AppsFlyer started as a result of a significant market shift – The introduction of smartphones, App Stores, and the app ecosystem. When we first started out, we used our key advantage as an early-stage startup – the ability to adapt quickly. We changed our plans, products, and even our mission constantly. This is what allowed us to build something that large software companies couldn’t. 

Mastering change made 2020 one of our best years to date. We kicked it off by raising a $210 million series D round led by General Atlantic, followed by the recent late stage addition by Salesforce Ventures. Mastering change enabled us to grow the AppsFlyer marketplace to 8,000 partners, support more than 10,000 app developers, reach 1,000 employees across 19 offices, and exceed $200 million in annual recurring revenue (ARR). 

Working in one of the fastest-paced industries in history, we know that we must always improve our ability to adapt to change. Throughout the years, we’ve created models that allow us to constantly improve our agility and resilience. We have built innovative frameworks to master change as a growing enterprise software company, as well as to leverage our massive scale, influence, and market reputation for the greater good of our ecosystem. 

One of the models we created is our invariants framework. This model assumes that everything is going to change, besides the things that are never going to change – the invariants. We focus on the invariants while iterating and experimenting on the variants – the changeable future. This is the source of our culture of learning and innovation. 

Our invariants are our four pillars: 

  1. Customer obsession
  2. Security and privacy
  3. Enabling innovation
  4. Data accuracy


“It is not the strongest of the species that survives, nor the most intelligent that survives. It is the one that is most adaptable to change”

Charles Darwin


Once COVID-19 hit, we quickly adapted to the new reality, and it was clear that our strong culture made this transition easier than expected. I am proud to say that according to an internal WFH survey we held earlier this year, 96% of AppsFlyer employees feel very proud to be part of the company. This smooth transition allowed us to keep on focusing on our customers and partners, who were also adapting to a changing reality and remote work. To do that we launched a suite of COVID-19/WFH products, to allow our customers to work remotely with comfort and ease. In addition, as some of our customers had to quickly adapt their advertising spend, we launched our Zero Budget Marketing plan, offering free engagement software tools and APIs to empower brands’ growth and leverage their owned media strategies. 

Later in 2020, we felt another tectonic shift which impacted the entire app ecosystem, when Apple announced its iOS 14 privacy guidelines updates in June. As the trusted industry leader,  thousands of worried app developers who now had to decipher what the changes meant for their business reached out to us for guidance and support. At times it seemed like AppsFlyer had become an Apple support center. While challenging, we welcomed the opportunity to assist the industry in its time of need and work with our customers and partners to build solutions. 


“With great power comes great responsibility”

Spiderman 


Given our leadership in the market, we felt the huge responsibility we have for our customers, partners, the end users, and the ecosystem as a whole. 2020 allowed us to connect everything we do into our overarching mission: putting end-users and the ecosystem at the center of everything we do. This also gave a new meaning to our unbiased position. AppsFlyer allows creators to leverage the ecosystem and platforms regardless of device, channel, app store, media or technology, for the ultimate benefit of their end users, while maximizing their privacy. A mission that every one of our 1,000 employees relates to, acts on, and is inspired by. 

Privacy has been a long term core pillar and area of expertise for us. Our agility and strong relationships within the app economy have allowed us to come up with innovative solutions to allow the ecosystem to comply with Apple’s new guidelines: Privacy-centric attribution for iOS 14 that leverages differential privacy, web campaign-to-app, and SKAdnetwork innovation. We also decided to expedite the release of two brand new products to better handle aggregated data: Xpend – an ad spend aggregation solution, and Incrementality – which helps brands test and prove incremental lift of their marketing campaigns. 


“No room for small dreams”

Shimon Peres 


I’d like to thank our investors for their support throughout this year. It allowed us to truly feel that there is no room for small dreams, and take on the wildest, long term mission we could possibly think of. Thank you for supporting our “revenue is secondary” mindset. It allowed us to invest in products that do not necessarily yield immediate returns, and focus on building the best software to allow the ecosystem to deliver great products and services to end-users while protecting and improving their privacy.  

In order for us to truly be customer-obsessed, we must first be obsessed with our own people. 2020 gave us a unique opportunity to walk the talk, and go all-in towards supporting our people during the pandemic and remote work. We also quadrupled our community support via AppsFlyer Cares and its dedicated COVID-19 fund. Hundreds of AppsFlyer employees globally have been involved in helping communities at need. We have no doubt that giving to others, especially in times of great uncertainty, is not only beneficial for our communities, but also encourages creativity and innovation within our own people. The best way to be fearless, is to be thankful. 

Thank you, the fearless AppsFlyer team and your families. I feel fortunate to be working with an amazing group of people who take our responsibility towards the entire ecosystem very seriously. Your resilience, agility, commitment to thinking like founders, and dedication to our mission are a constant source of inspiration to me. I am proud of each and every one of you individually and as a team.  

Thank you to our 8,000 industry partners. In our constantly changing industry, people deserve clarity, education, and choices – not uncertainty and confusion. In 2021, we look forward to continuously unifying the ecosystem collaboration across all partners, including the major platforms, for the benefit of the ecosystem and ultimately the end-users. There are solutions that can maximize users’ privacy while providing value and a superb user experience. Some of them were introduced in 2020, and some will be introduced in the coming weeks and months.

And finally, I’d like to thank our customers for their trust. We take this responsibility extremely seriously. We are committed to supporting you and your needs through current and future changes as our industry evolves.

2020 was one of the most challenging years the world has seen in decades. But it was also one of the most enlightening. Overnight we all had to change and adapt. Experiencing change, means that you are blessed to be alive. The human spirit is resilient and 2020 proved that. I have no doubt that 2021 will introduce additional challenges, and I am more confident than ever that we, and you, are better prepared for another year of challenges, learnings, and innovation.

No changes, no opportunities. So bring it on 2021. We are, as always, 1% done.

The post 2020: An exercise in mastering change appeared first on AppsFlyer.

Everything marketers need to know about incrementality testing

$
0
0
incrementality test guide for marketers

How do you know, for real, the money you are spending on marketing is money well spent? How do you know if your ads are actually impacting consumer behavior? 

The truth is only a certain type of measurement can answer this question with absolute clarity.

It’s called incrementality testing.

Incrementality testing measures the true, and often hidden, ROI of your advertising spend. Why hidden?

Well, the lines that separate organic traffic and paid conversions are often blurry. It is entirely possible that you are paying to acquire new users that would have converted anyway. Incrementality testing is the best way to uncover this hidden relationship and ultimately know the true value of marketing.

Measuring incrementality is more than simply suspending your paid media activity for a week and analyzing the effect. Running these kinds of tests is a tricky business so the point of this article is to show you how to calculate incrementality and how to interpret its results.

We will also take a look at how it differs from last-click attribution (through post-install optimization), and leave you with an overall understanding of this increasingly important form of measurement.


How is incremental impact determined?

Incrementality tests consist of two groups – test and control. The test group is exposed to ads while the control group is kept aside for analysis.

By measuring the results from each group you know which conversions — whether related to acquisition or remarketing — would not have happened without advertising. This is known as incremental lift.

For example, in the simplest terms, Marco’s Pizzeria launches a new thick crust pizza and wants to determine how successful their advertising campaign is. After a month of handing out coupons to passersby they measure how many of the new pizzas were purchased using the discount coupon and how many were purchased without it. The difference in sales between the two groups of clients is the incremental lift.

How is incremental impact determined? test group vs control group


3 types of incremental effect

Incrementality experiments can deliver a range of results as follows:

Types of incremental lift effect

In the first example we can see that the experiment led to a positive incremental lift. That means your paid campaign was effective as it generated an increase in revenue. 

In the second example there is no incremental lift and it remains neutral. While the campaign is generating sales, it has no incremental value and the marketing team needs to consider pausing the campaign or trying a different approach (change the creative, update targeting etc).

In the final example we see a negative incremental lift. Although it’s rare, it is possible that an advertising campaign is doing more damage than good (for example, over-exposure in a remarketing campaign that leads to negative brand impact). It’s also worth looking into the test itself and make sure that it’s configured correctly.

Subscribe to AppsFlyer content

The latest mobile marketing tips & trends delivered to your inbox.

How does incrementality testing actually work?

First, let’s explore some key terms and metrics. 

Below are some definitions of the terminology which surrounds incrementality and will help us understand the process even better.

Term Definition
Key Performance Indicators (KPI) A measurable value that demonstrates how effectively a company of app is achieving their KPI business objectives
Control group A segment of users who will not be exposed to the ads served to the test group in a given campaign audience
Test group A segment of users who will view the ads in a given campaign
Statistical significance A measure of the likelihood that the difference in results between the control and test group is not a coincidence
Incremental lift The percentage difference of the test group from the Control group

Moving on to the process. An incrementality test is similar to other scientific experiments. You have your hypothesis, method, collection and analysis of results, and your conclusion. With incrementality testing there are five distinct stages; Define, segment, launch, analyze, and take action. Let’s dive a little deeper.

How does incrementality testing process actually work

Defining your goals

When starting an incrementality experiment, it is important to define your hypothesis and identify any vital business KPIs that you want to examine further. Think about what you are looking to prove using this scientific method.

For example are you examining the number of installs, ROI, ROAS, or a different metric all together?

Segmenting your audience

When running an incrementality test on a remarketing campaign, select the audience you want to run this experiment with and make sure that you properly segment a section of this audience as a control group. 

Pro tip: Your attribution platform will most likely be able to help you segment your audience as you wish and build your campaigns accordingly. 

The groups – control and test – should have similar characteristics but not overlap. 

Incrementality testing: Segmenting your audience

This can be tricky when focusing on UA (user acquisition) campaigns as we don’t know the audience in the absence of a unique identifier. To explain, a unique identifier is exactly that. A particular identifier, such as an ID or code, which differentiates it from others, making it unique. 

However, there are other identifying factors you can segment your audience with including parameters such as geo, time (similar to the three types of incremental growth above), products, or demographics.

Launch the experiment

Decide the duration of your test and the testing window and launch it.

Best practice states that the duration of your experiment should last at least a week.

The testing window, which is the days of user action preceding the test is dependent on your app’s business cycle and the volumes of data you have to work with.

The test and testing window should be planned for a time when the calendar is clear and this will give the most accurate representation of the effectiveness of your campaign.

Analyze the data

Once you’ve collected all the data from your control and test groups, aggregate and compare to identify the incremental lift in a specific KPI, according to your goals. 

Understanding the relationship between the results from the control and test groups, will help explain why there was a positive, negative, or neutral incremental lift. 

If you notice a wide gap between your control and test groups it may be an indicator that there is something wrong in the configuration of the experiment and you might choose to retest. 

While incrementality testing can be quite challenging to set up on your own there are attribution providers who offer integrated incrementality testing tools. From the test you will be able to ingest all of the test data directly from your attribution platform into an incrementality dashboard — a significant advantage making the process more streamlined and efficient. 

Take action

Based on the information gained, apply the insights to your campaigns to maximize impact. This could be the best messaging for each target audience, the optimal time for re-engagement, or the most effective media source, to name a few.


2 key methods to measure incrementality

Once you have accumulated and aggregated the data, how do you then go about calculating the incremental lift? 

There are two main methods:

1) Incremental profit

Measure lift by pinpointing the incremental profit of the real value of a given media channel. This can be calculated by subtracting the control group profit from the channel profit.

For example, let’s say you spent $2,000 on a campaign. Media Channel A generated $5,000 in profit and Media Channel B generated $3,000. On the surface, these both look like profitable channels. However, your organic campaign also generated $3,000 so the incremental profit on Media Channel B was zero.

Channel Spend Profit Incremental profit
Media Channel A $2000 $5000 $2000
Media Channel B $2000 $3000 $0
Organic $0 $3000 N/A

By understanding how much profit you gain through your control group, you see that anything you generate below that value gives you no incremental profit. 

Basically, you’d be making the same profits without advertising to them, so save your budget and invest in a channel, activity, media source, campaign, etc. that can deliver more impact.

2) Incremental lift

Use the following formula to calculate incremental lift:

Incremental profit formula to measure incrementality

To show how this works we can attach numerical values. So, let’s say that your test group generated 10,000 conversions and the control group resulted in 800 conversions. So 10,000 minus 8000, divided by 8000 is 0.25. 

A 25% incremental lift can be judged as good or bad against your KPIs and ROAS. 

One way to test this is to measure it against cost. Divide the cost of acquisition (CPA) by the incremental lift to see if it is equal of higher to your LTV.  

For example, if your CPA is $2, divide that by 0.25 which equals $8. If you LTV is higher than $8 you are doing well. If it is lower than that, you may need to reassess your campaign strategy.


Incrementality vs. A/B testing

Now that you’ve got the gist of incrementality testing, you might be wondering, is it actually that different from A/B testing?

The first thing to stress is that incrementality is essentially a type of A/B test. Standard A/B testing divides your product or campaign into two, A and B, and then divides your audience into Audience 1 and Audience 2. Then you apply different versions of the product or campaign to the different audiences and see which delivers the better results.

For example, one audience sees a banner with a blue button, and the other sees the same banner but with a red button. Comparing the banner’s CTR for each audience is a standard A/B test in marketing.

Where A/B testing differs from incrementality is the control group, where one portion of the audience is not served any ads at all during this time.

If we go back to the example above, incrementality will inform you whether running a given ad is better than not running the ad, compared to whether an ad with a blue button outperforms the same ad but with a red button.

How do you not serve ads to an audience, yet still “own” the ad real-estate?

There are three methodologies:

  • Intent-to-treat (ITT) – this method calculates the experiment results based on the initial treatment assignment and not on the treatment that was eventually received (meaning you mark each user for test/control in advance and do not rely on attribution data. You have the “intent” to treat them with ads / prevent them from seeing ads, but there’s no guarantee it will happen).
  • Ghost ads/bids – this is another example of a randomly split audience, but this time it is done just before the ad is served. The ad is then withheld from the control group, simulating the process of showing the ad to the user, known as ad serving, without paying for placebo ads. This is a tactic mostly used by advertising networks carrying out their own incrementality tests.
  • Public Service Announcements (PSAs) – these are in place to show ads to both the test and control group however, the control group is shown a general PSA while the test group is shown the variant. The behaviors of users in both groups are then compared to calculate incremental lift. 


Incrementality vs. ROAS optimization

Incrementality testing is not a replacement for traditional attribution models. It works in unison with attribution to help you better measure your performance. 

Note: If you are only measuring installs then this is insufficient when it comes to understanding your ROAS. 

Marketers need to be measuring and optimizing based on a range of post-install metrics, and the further down the funnel you go the better. By focusing on LTV and, most importantly, factoring your media costs, you should be able to see if your ROAS is positive. 

Incrementality works within this framework and tells you if you could have an even better ROAS by spending less on advertising and still gaining the same revenues from organic users. 

The incremental impact on ROAS (aka iROAS) is calculated by taking the difference between your test group revenue and control group revenue and dividing that by the total ad spend. By removing organic conversions from the equation you are able to calculate the true impact of a campaign and optimize accordingly. 

 incremental impact on ROAS formula (aka iROAS)

For example, if your iROAS is less than 100% you can redistribute budgets to better-performing campaigns and channels. If it is equal to or higher than 100% you know you are not cannibalizing organic traffic and that your ads are effective.

With the prefix of incrementality, marketers have an additional and vital layer of information to optimize ROAS to its full potential. Here lies the difference between simply measuring your ROI / ROAS and seeing the incremental lift or impact of your marketing campaigns on ad spend.


The benefits of incrementality testing

Marketers who use incrementality testing are able to highlight, with confidence, exactly how effective their campaign was. Not only have you identified the impact to your iROAS, but you can apply these insights to future marketing strategies.

For example, incrementality testing will be very useful when testing a new media channel before deciding whether to invest more heavily. You can also use incrementality testing on small media campaigns to see if there was a positive ROAS. If the answer is yes, then you can confidently scale marketing efforts in that channel.

Another example where incrementality testing comes in handy is when it comes time to create a re-engagement strategy. Incrementality testing helps highlight the optimal day, post-install, to re-engage users and to ensure the highest incremental lift from your marketing efforts.

Armed with this knowledge, you as a marketer will be able to make better-informed decisions about which channels are delivering the highest (real) impact and where to invest your marketing budgets.


The challenges of incrementality testing

Of course no method is without its challenges and incrementality is no different. 

It is important when creating your control and test groups that you remove any noise or external factors which may impact user behavior. You also need to try and clean the data and make sure there are no overlapping audiences as this may also skew the results. 

Deciding on the parameters of your experiment is also challenging. Each app has different volumes of users and therefore you need to decide the best segment size to test without damaging your existing marketing efforts. 

Taking too small a segment will render your results insignificant, so it’s a tradeoff between achieving optimal results that you have confidence in, and the cost of maintaining a lengthy test period. 

It’s not always possible to press pause on all of your marketing campaigns for a week, or a month, so in this instance, if you want to see results without spending any more time, it is recommended to close the lowest-performing marketing source and measure there. 

Identifying and excluding outliers is another important step as this can skew the data and lead to incorrect conclusions. The volume of data will affect how impactful the outliers will be on the results so, again, it is an important factor when considering the benchmarks for your experiment. 

Be aware of seasonality. Dates in the calendar like Black Friday, Cyber Monday, Easter, and the holiday season will all affect user behavior. Choosing the right time to start running your test is therefore crucial. 

Comparing these results to quieter periods will bring up very different results. As an app marketer you can decide the best time frame to run an incrementality test based on your business model and typical user trends. 

Lastly, incrementality testing poses some engineering challenges. These experiments are complicated and require a lot of developers and expertise to create the technology required to deliver the most impactful results.  

For example, connecting to each ad networks’ API, receiving and aggregating all of the raw data, removing outliers, and calculating the statistical significance of your results is a ton of hands-on work 

Working with an attribution provider to include their incrementality tool will help save time and money. The data is all there in your attribution dashboard, so you can easily segment and aggregate this information into incrementality experiments. 


Key takeaways

Incrementality is a powerful tool that can give you real insight and confidence in your channel selection, budget allocation, and ROAS measurement, while ensuring your marketing efforts reach their full potential. 

To achieve this you should remember to:

1) Adopt a holistic approach, focusing on both paid and organic traffic, keeping in mind the complex relationship between them.

2) Make sure your data is clean. Remove the noise, the outliers, and the overlapping audiences to ensure your experiment delivers statistically significant results. 

3) Define your KPIs before building your campaigns and make sure to properly segment your audience. 

4) Ingest, aggregate, and compare the data to identify the incremental lift of your campaigns. 

5) Optimize budget allocation and maximize ROAS with a better understanding of which channels are delivering the highest incremental lift, which cohorts are more receptive to advertising, and what time is optimal time to re-engage users.  

LTV or ROAS-driven optimization are vital to measure the value of your campaigns, but it is only with the addition of incrementality can you get the ultimate seal of approval on campaign effectiveness.


The final word: Measurement in the age of privacy

Apple’s upcoming enforcement of the ATT framework, as part of iOS 14’s privacy-driven approach, will largely eliminate the ability to measure via device matching. 

But since Apple’s SKAdNetwork only captures about 68% of installs driven by non-organic activity, other measurement methods will become increasingly important in order to fill the gap and allow you to make smart, data driven decisions, methods including probabilistic attribution, web-to-app, and, you guessed it — incrementality!

The post Everything marketers need to know about incrementality testing appeared first on AppsFlyer.

3 main challenges for apps entering China and how to overcome them

$
0
0
Apps entering China: Overcoming main challenges

In China, nearly 1 billion people connect to the Internet with their mobile devices. The sheer size of it means mobile apps cannot ignore this mega-market, especially as it shifts from a focus on quantity to quality.

China is now entering what is known as the “second half of the Internet game.” The first half was marked by high-speed user growth; the second is marked by the growth in the number of quality users, the result of the country’s economic surge, and an ever-expanding middle class.

The average Chinese user has over 60 apps on their mobile device, spending 5.1 hours a day consuming and creating content. Usage leads to revenue. A PWC 2019 survey found that no less than 86% of China’s population uses mobile payment apps—the highest in the world, by far.

On top of that, China’s Internet infrastructure is entering the 5G era, further improving the experience and generating greater demand for mobile apps.

Globalization has made China a land of massive opportunities, but the market is also incredibly complex and challenging. 

This blog will sum up the three main challenges. For a complete breakdown of this market, download our new comprehensive guide The China APPortunity .


1) Measurement challenge: A different animal altogether

In China, measuring and attributing iOS installs mostly works the same way it does outside of China. However, Android is completely different on all fronts.

While China is home to the largest number of connected users in the world, the fact that hundreds of 3rd party Android stores replace the single Google Play store (remember, Google does not operate in China) makes app install promotion and measurement a significant challenge.

App stores in China

Releasing your app in a single store is not an option unless you have an incredibly strong, established brand that will draw players to that store. Most developers have to upload different APKs to each Android app and pay for each download no matter if it’s an organic or non-organic user.

Attribution providers like AppsFlyer can overcome these challenges by:

  • Implementing attribution based on OAID
  • Using device IMEI as an alternative to GAID in devices with Android API version 28(Android 9) or before
  • Preparing APKs with unique identifiers to detect Android store hijacking
  • Configuring attribution links that are recognized within China

A few things to keep in mind about APKs:

  • Many Chinese developers set up an in-house APK packing tool to improve the efficiency of preparing dozens of APKs for each Android store and each release of a new version of an app. There are existing vendors that provide APK packing tools.
  • Be aware of the different types of Android stores. Android stores can be divided into two types—mobile device manufacturer-owned stores (hereafter referred to as OEM stores) and stores owned by internet giants, which are referred to as third-party stores.
  • Beware of fraud. The cost-per-download model results in the Android APK hijacking phenomenon, which puts the entire accuracy of attribution data at high risk. Attribution providers can solve this problem.


2) Legal and bureaucratic Challenge: Legally transfer your app’s data outside of China

For mobile marketers, another challenge is often rooted in balancing the need for privacy and security with the enormous opportunity presented by the growth in available data. To do that, you’ll need to adhere to China’s cross-border transmission requirements, but what does that mean exactly?

China has strict regulations to avoid data generated in the country to be hosted outside of China. Therefore, foreign apps are not allowed to send the data generated in China to a server overseas (for example, Apple‘s iCloud service has a stand-alone server in China).

Beyond the issue of storage, there are also regulations that relate to the transfer of data outside of China. In order to ensure a free flow of data, the app’s data controller or processor needs to conduct a data security assessment and submit a report to several government departments that handle the cross-border transmission of personal information and important data. It is a requirement imposed by the CSL (The Cybersecurity Law of the People’s Republic of China), which is the government body in charge of setting implementation standards.

Last but not least, before launching your app in China you need to obtain a license. Often, multiple contracts must be signed prior to launch, particularly with games (for example ISBN, International Standard Book Number)

So, make sure that you:

  • Learn about China’s cross-border transmission requirements, and closely evaluate CSL compliance before entering the Chinese market.
  • Prepare licenses for your apps, including a Software copyright certificate and ISBN. Here is a checklist to follow (download the guide for full details):

Check list for entering China


3) Localization challenge: It’s not only about language

Product localization demands not just translation but also adapting the app’s features, design, and settings to align with Chinese user preferences.

Different app developers have different perspectives on the extent of product localization. Some build a custom Chinese version of their app, while others are confident that the content, features, design, and creative style of their app is attractive no matter what the region, so they focus on translation. There are success stories with each approach.

Chinese users have different habits as far as payment methods go. As such, credit cards are not widely adopted, while WeChat and Alipay are must-haves.

Furthermore, different Android stores have different payment settings that need to be customized. Gaming apps also need to embed each store’s payment SDK in order to allow for a revenue share. On Android, the ratio varies from store to store. In July 2019, Tencent Games initiated discussions with Android stores to adopt a 70-30 share ratio instead of 50-50.

For iOS games, Apple Pay is the only method, and the 70-30 revenue split through Apple’s App Store is the same as it is for the rest of the world.

For non-gaming apps, developers can integrate with a payment method of their choice (AliPay, WeChat Pay, credit or debit card, and others). AliPay and WeChat Pay are two must-have methods given their market share and users’ habits.

Here are some examples of payment pages inside local apps:

examples of payment pages inside local apps in China

What is the solution?

User preferences vary widely among individuals and cultures. If you are uncertain about your app’s suitability with respect to Chinese users’ preferences, rely on data. Leverage your attribution data in your product or marketing analytics suites using pre-configured integrations that include local platforms.

For an in-depth look at the above challenges and much more, The China APPortunity is a must-read guide for mobile app marketers who are considering entering the Chinese market. It covers the following:

  • Latest market insights, many based on Chinese sources
  • Strategies for seizing new opportunities and overcoming challenges
  • How China’s Internet landscape differs from other regions
  • Step-by-step instructions on how to set up an app in China
  • Success stories from Gismart, Lightricks, SKYROCKET, and Ubisoft

The China APPortunity Guide 2020

The post 3 main challenges for apps entering China and how to overcome them appeared first on AppsFlyer.

The gaming genre affinity matrix: Which players play which games?

$
0
0
Mobile gaming genre affinity matrix guide - featured

It is a well-known fact that mobile gaming is exploding: 2.6 billion people now play about 1 million mobile games spread out across [at least] 17 types of gaming genres.  

But what is mostly unknown is whether players of one genre tend to play the same genre, or a similar genre, or perhaps a completely different genre? Do Casual gamers only play Casual games or do they also play more advanced Role Playing games?

From the gaming studios’ point of view, genre diversification is on the rise as a growing number of companies are looking for the next niche and patches of less busy ground to make money from. An analysis of 800 gaming studios which have been working with us in the past three years found that: 

  1. 28% increased the number of genres between 2018 and 2020, compared to 18% who had fewer active genres and 54% unchanged. 
  2. 6.5% had running games in 5 or more genres in 2020, while nearly 30% were active in 2 to 4 genres.  

Likewise, marketers are constantly on the lookout for growth opportunities and ways to optimize their campaigns with sharper targeting. One way is through genre-driven segmentation.  

So which games should studios develop or acquire? And which genres should marketers target, now that contextual advertising is about to make a comeback in the absence of IDFA? (after Apple enforces its AppTrackingTransparency framework)

Our new gaming genre affinity matrix can provide some answers ahead! 


The global affinity matrix

We analyzed over 350 million unique devices from November 2020, and here are the results, based on the current categorization in the app stores:

For the complete gaming matrix broken down by country, click here:Gaming genre matrix in top markets

How to read the matrix

By row: The numbers tell us what the share of users who play genre x and also play genre y, genre z, etc. For example, we can see that 26% of Puzzle players also play Action games, while 38% also play Casual games.
 
By column: The numbers in the column show the share of genre x players who play other genres. As such, it is not as impacted by the genre’s scale as the row. To follow-up on the above example, the Puzzle column cell that intersects with Casual shows that the same 38% are also 19% of Casual users.
 
Now, let’s assume that you want to run a campaign for your Puzzle app, should you target Casual games (19% of whom play Puzzle), or would Word games (36% of whom play Puzzle) be a better choice?
 
In most cases, despite the fact that 19% of Casual players represent a much larger number than 36% of Word players, it would be wiser to run on Word games with an affinity rate that is more than double that of Casual.
 
If you are running a CPM campaign, your chances of success in Casual are less than half compared to Word, so Word is the obvious choice. But even if you are only paying for installs in a CPI campaign, it appears Word is still a better choice because it has a closer affinity with Puzzle. And with higher affinity, there are better prospects of improved performance and lower churn.
 

More ways to leverage matrix data ahead ↓


Key findings

1) Size matters, to an extent. The matrix data shows that Action, Casual, and Arcade games are by far the most popular genres, which means the likelihood that these games are installed on the average smartphone are high, regardless of the types of other games the user plays. 

In fact, in only 2 of the 16 genres the highest share of a specific genre was the same genre. In most cases, the highest share on average was found in one of the biggest genres.

But as we’ve mentioned above, higher affinity (as seen in the column) is often a better indicator.

2) iOS and Android dominate different categories. A platform level analysis shows that some genres are completely dominated by either iOS or Android. 

Android’s average share of Music users who play other genres is 140.8% higher on average than iOS. The same goes for Action (56.7%), Arcade (58.3%,) and Strategy (38.7%). On the other hand, iOS dominates Puzzle (27.8%), Social Casino (31%) and Word (42.4%).

The reason for this gap can be found in the operating system split in each sub-genre and the relative popularity of different genres in different countries. In the categories dominated by Android, the average ratio is 76/24 in favor of Android, while iOS dominates its categories thanks to a 55/45 split in favor of iOS.  

3) Social Casino players hardly play other types of games. The largest gap in the share of players who stick with their own genre belongs to Social Casino apps. According to matrix data, 32% of Social Casino players also play at least another Social Casino title, 7 times more than the average of all other genres. The only genre with a decent result is the similar Card genre at 16%.

The fact that people who like these games don’t really play other games as much is probably the result of how these games are designed (it is important to stress that Social Casino games are not gambling/real money games).

4) Affinity demonstrated among mind games. The matrix shows that the percentage of users who play mind games like Puzzle, Word, Trivia, Board, and Card is much higher amongst these genres compared to their number among Midcore and Hardcore games. 

5) Some players mostly stick with their type, but some mix it up more. A sub-category* level analysis (see the end of the blog for more details which genres make up the different sub-categories) found that:

In some cases players mostly play games in the same group, with Social Casino leading the way at 32%, which is 7 times more than the average of other genres. Hardcore players also have a higher affinity with other Hardcore titles (57% higher than the average among other genres), as do Hyper Casual players (20% higher).

The Casual group had the lowest share of users in their own genre compared to other genres. As such, 65% of Hyper Casual players and 56% of Social Casino players also play Casual games, compared to only 46% of Casual players themselves. 

Similarly, although 57% of Midcore title users play other Midcore games, it is far less than their share among Hardcore players (74% of whom play Midcore titles), and even less than the 65% of Causal and Hyper Casual who play Midcore titles. 


How matrix data can help inform decisions 

For developers — suggest genres suitable for portfolio expansion. With genre diversification on the rise, developers can use this data to suggest a potential course of action to expand their portfolio: either via acquisition or in-house development. 

For marketers — inform decisions on multiple activities, including:

1) Segmentation for UA: Genres with a high level of affinity to a particular genre/s should at the very least test a campaign with this segmentation. In the age of privacy, particularly with the pending limited availability of the IDFA due to Apple’s AppTrackingTransparency framework (ATT), contextual targeting becomes more important. Running a campaign segmented by genre is just that: it’s like running ads for luxury cars on luxury travel destination websites. 

2) Smarter monetization of ad space: Apps that generate revenue through ads can prioritize genres with high affinity to their own. They can blacklist or whitelist apps on the campaign level (based on genre or list of apps depending on what their ad network can offer). These users are more likely to install and play games in high-affinity genres, which can yield higher ad revenue.

Even if the publisher is paid on a CPM basis, it should still care about how the buy-side and ad network perform. After all, if users are more likely to install and engage with a high-affinity genre, the network will earn more in a CPI or CPA campaign, leading its algorithm to prioritize the app. 

Knowing the value of its real estate to certain genres, the advertiser can also increase its CPM, and the network may agree if it delivers high-quality users.

Marketers can even choose to run ads for games in their own genre, particularly in cases when their share is high as seen in Action, Casual, Puzzle, Word, Role Playing, and Social Casino. 

Although they can be considered competitors, there are times when this can make sense. For example, if and when apps are able to recognize that a user is about to churn, and they do not have another of their own apps to cross-promote. In such a scenario, they could decide to sell ads to a competitor for the right [high] cost. 

3) Cross-promotion optimization: Studios with multiple genres in their portfolio can pinpoint cross-promotion campaigns with matrix data, and inform their optimization for increased effectiveness.

4) Private deals: If a high percentage of users who play genre x also play genre y, it is worthwhile to close a private deal for a UA campaign with app/s in this genre (often facilitated by an ad network). As mentioned above, this is a form of contextual targeting that is becoming increasingly important in the age of privacy and Apple’s ATT framework.

5) Private marketplace (PMP): In the framework of a private marketplace (programmatic auctions for an exclusive and select number of buyers and sellers), premium publishers can sell their real estate for a higher value to a select group of interested buyers. On the other side, buyers can decide to offer more for what they consider to be top real estate that will deliver high-quality users.

To sum up, genre affinity data can be very useful for developers, marketers, and ad networks alike. Use it wisely!

For the complete gaming matrix broken down by country, click here:gaming genre matrix by country market

* Genre groupings were comprised of the following app store categories:
Hyper Casual (not categorized in app stores): Apps with at least 90% of revenue coming from ads (based on AppsFlyer data)
Casual: Casual, Puzzle, Card, Board, Word, Educational, Trivia, Family, Sports
Midcore: Adventure, Simulation, Action, Arcade, Racing
Hardcore: Strategy, Role Playing
Social Casino: Casino (not real money)

The post The gaming genre affinity matrix: Which players play which games? appeared first on AppsFlyer.

iOS, the winds of 2020, and the growing significance of the web

$
0
0
iOS, the winds of 2020, and the growing significance of the web

2021 is finally here, and seven months after Apple’s dramatic privacy announcements, the dust is settling. On the surface, it may appear that the market is still dazed and confused and that advertisers are reacting like deer in the headlights now that they may have less granular data for user acquisition and engagement efforts. 

But from conversations with AppsFlyer customers and analyzing AppsFlyer data from 2020, it appears that advertisers recognize that the rules of the game have changed. In fact, there’s a trend: advertisers are exploring new acquisition channels, such as owned media, and examining strategies that connect previously disparate digital touchpoints.

One area in which advertisers are showing interest after the iOS 14 announcements is web-to-app flows, in other words converting web visits, especially those with high-intent, into new and return app usage. 

Why is there interest in web-to-app? From what we’re seeing, the web is making a comeback among app marketers due to new behavior patterns among consumers and advertisers.  In particular, the mobile web is an increasingly important touchpoint – with search often being the starting point – as consumers use it to learn about a brand, its offerings, products, and services, and what it can do for them. Advertisers are taking note and reacting accordingly.

Consumers see web as a pre-install touchpoint

In terms of consumer behavior, as AppsFlyer’s recent 2020 Trends report shows, the number of app installs with a preceding visit to a brand’s website nearly doubled in 2020, with nearly 10% of installs including a previous web visit.

Among apps that were live throughout the measured timeframe

What’s interesting to note is that this is a trend on the users’ side of the equation. In other words, this is not the result of numerous advertisers changing up their game to build web-to-app journeys. Though many brands are certainly exploring web-to-app, the overall percentage of advertisers aiming to convert web visitors into app users is still relatively small.

There are a few reasons for the uptick in consumers spanning web-to-app:

  • Wiser consumers: Users across all cohorts have become savvy when it comes to researching brands on mobile devices; the watering hole for research is the web. Web exploration and evaluation especially for ecommerce, travel, and food and drink are part of what Google recently called the “messy middle,” the difficult-to-follow shopping experience between “triggers and a purchase” that take place on the web and in-app. Though the study is about shopping journeys, it is fair to say that it describes the way people “shop” for apps as well, starting with search terms such as “best fitness app”, “Los Angeles best delivery app”, etc.
  • COVID-19: On top of these trends, COVID-19 ushered in a period in which people have spent a lot more time on their mobile devices, surfing the web to explore, evaluate, and find optimal ways to “get things done” (shop, work, exercise, play) in apps; in other words, they’re searching the web for ways to do things better and improve their lives via apps.
  • Mobile and app install advertising: Advertisers use paid (Facebook, Google Ads, etc.) as well as owned (email, SMS, QR codes, etc.) media to drive traffic to their websites. Mobile advertising is set to grow by over 40% in the next four years (eMarketer). As mobile advertising grows, consumer click throughs to the web will grow.

Subscribe to AppsFlyer content

The latest mobile marketing tips & trends delivered to your inbox.


Advertisers view web as a key media channel

Just as we’ve seen an organic trend by mobile users to head to the web before making decisions – whether it’s an outright purchase or an app install – we’ve witnessed advertisers considering a shift in ad spending. In a recent MMA/AppsFlyer survey, 19% of marketers “strongly agree” and 41% “somewhat agree” that they are likely to shift budgets within mobile. Many of our forward-looking customers are exploring the web as an attractive source for UA and engagement, confirming these data points.

Though we’re still at the beginning of this new trend, here are five suggested reasons for increased advertiser interest in the web:

  1. Costs: Brands are exploring ways to reduce costs and increase ROI by using web campaigns instead of and/or in parallel with app campaigns. 
  2. Increased retention: Brands recognize that consumers are installing apps only after exploring and understanding the product benefits and offering (e.g., ecommerce, travel, and food & drink).
  3. Registration on the web: Some brands, for example, media streaming companies with subscription models, prefer that users register and pay on the web, before directing them to their app.
  4. Expanding reach: On some platforms such as Facebook and Google Ads, not everyone who sees an “app ad” will see a “mobile site ad” and vice versa.
  5. IDFA and SKAdNetwork: Brands are working with attribution providers to retain attribution functionality despite the difficulties surrounding Apple’s iOS 14 changes. Full visibility into web-to-app journeys, available despite IDFA loss and lack of coverage from SKAdNetwork, opens up new opportunities for advertisers in a post-iOS 14 world. 

Cross-channel journeys drive digital transformation

Finally, in parallel to these five points, we’re seeing first signs of the traditional silos between web and mobile app organizations cracking. Many of our future-focused customers understand that user journeys and flows involve a gamut of touchpoints — mobile web, desktop web, apps, and email and social (which are also apps, technically). To Google’s point, this is part of the messy middle, with users going back and forth among these channels as they explore and evaluate products and services.


Google's messy middle model

Google’s “messy middle”

In essence, we’re seeing signs of a digital transformation brought about by a combination of forces unleashed in 2020 – iOS 14, COVID-19, new consumer and advertiser behavior riffing off of each other, and web-to-app.

How is this transformation playing itself out? Brands are connecting the dots among web-to-app touchpoints and as a consequence adjusting their organizations accordingly to facilitate the design, implementation, and measurement of smooth user experiences across the new flows.  

Stay tuned

In this blog, we showed how and why the web is making a comeback thanks to a confluence of forces and new behaviors that coalesced in 2020. In the next blog we’ll show specific ways in which brands are taking advantage of web-to-app funnels. 


The post iOS, the winds of 2020, and the growing significance of the web appeared first on AppsFlyer.

Navigating Fintech in Africa: Driving app downloads in the age of social media

$
0
0
fintech africa

Africa’s mobile growth is unlike most regions in the world. GSMA (Global System for Mobile Communications) estimates that by 2025, the total Sub-Saharan mobile subscriber base will reach a whopping 600 million. 

Compounding on this increase in mobile subscribers will be improved 4G connections, to a rate of 23% more by the year 2025. One can confidently assume that the app industry will make similar gains.

As in all industries, there are a number of prominent players , and  the financial sector is no different. In assessing the landscape, it’s important to look at the leaders who provide the blueprints on how to enter the social media space and make the most of the tools available along the road to success. 

Across the continent, Fintech is proving itself to be one of the most attractive sectors for prospective investors. While innovation is not confined to any region, the continent’s biggest hotspots are in South Africa, Kenya and Nigeria.

According to a March 2019 report by Venture Capital firm Partech Africa, 33% of all funding raised by African tech start-ups was in the Fintech sector, totalling $370 million.

Some of the most respected apps in Fintech include 22SEVEN and Luno in South Africa, PayStack, Kudi and OneFi in Nigeria and Tulaa and Lendable who operate out of Kenya. Innovation is at the core of what fintechs do but, like most businesses today, part of their success has to be attributed to the power of social media. And that power lies both in its reach and targeting.


Why Social Media?

In South Africa alone there are over 22 million active social media users. The number increases to 180 million when you include Nigeria (120M), Kenya (48M) and Ghana (12M). While at first glance that may seem like too large a pool to draw any meaningful insight from, most social media platforms have extensive targeting tools that can define and isolate specific audiences suited to a brand’s needs. 

This double-edged approach — reach and targeting — is why a thorough social media strategy is an essential part of any marketing campaign.

Social media is also effective in the region because of its ability to make an impact at different stages of the marketing funnel. It allows for the promotion of the app before launch, speeds up downloads (which means it can be featured on the Google Play and Apple App Stores), creates buzz and word of mouth, and keeps existing users informed and engaged. 

This can all be done at a relatively low cost: across sectors, social media in Africa provides a Cost Per Impression (CPM) several times lower than traditional channels like television and out of home advertising. Although it is more expensive within the app space, it provides high value users in return.

Acquiring new customers can be a difficult task even for seasoned marketers, so choosing an acquisition strategy is a crucial first step in your marketing process.

One such strategy involves CPA campaigns or Cost-Per-Action campaigns. These are relatively low-risk strategies for the advertiser that can drive more sales from your app because payment only has to be made when a specific and meaningful action takes place. An action could be a purchase, a newsletter sign up, or one of several other conversions. 

Check out AppsFlyer’s MAMA Minute at Home as Google’s Rama Afullo shared his tips on marketing your app for success in Africa:


The Power of Media Publishers in Africa

A robust digital marketing campaign in Africa cannot exist without a combination of social media and digital media owners, like Verizon. Although not strictly considered Social Media, Verizon Media is among the most successful platforms for user acquisition

As the owner of brands like Yahoo, Yahoo Mail and TechCrunch, the Verizon stable has access to over 15 million unique users across Sub-Saharan African and the platform’s appeal doesn’t end there. 

In addition to reach, the platform has flexibility in its pricing and ad formats. The added benefit of being aligned with news organizations adds an element of credibility that Fintech businesses should take advantage of.

Businesses can choose between ad formats, two of them being:

  • Display ads: Traditional ads that appear at the top or side of a webpage. These are considered highly effective in getting the word out about your app and sparking sincere interest. 
  • Native ads fit the form and function of the webpage on which they appear. They are great for encouraging trial, as the format has been shown to produce Click-Through Rates (CTR) 3 times higher than banner ads and superior targeting can lower the Cost Per Acquisition (CPA) by 80%.

For the best possible performance, running app installs as an auxiliary campaign alongside native image or video campaigns for awareness can maximize audience penetration.


Getting creative

Snapchat has proven to be useful in attracting and cultivating a specific audience, mainly millennials and Gen Z users. In South Africa alone, Gen Z makes up over 45% of the population, almost 27 million people. 

These figures are comparable to many countries in Sub Saharan Africa who have very young populations. Since 25% of them are credit active, Gen Z makes for a large and financially significant segment.

The platform’s uniquely creative, full-screen advertising environment can set your brand apart amid a crowded marketplace. 

Popular for app install campaigns in Nigeria, Kenya and South Africa, Snapchat is an inherently mobile environment, with users spending an average of 30 minutes a day browsing the platform. There is ample opportunity to attract them during this extended screen time. 

South African insurance disrupter, Pineapple, recently ran a campaign on Snapchat which matched both brand and platforms’ flair for the creative to great effect.

fintech snap creative example

Pineapple campaign on Snap

Managing cost is often the most important factor behind an app’s success. An effective way of doing this is to master remarketing (also known as retargeting) and customer retention as it has a strong impact on an app’s ROI in the region. 

App developers spend a lot of time and resources trying to acquire new users, but re-engaging existing users can be a smarter way to get existing users excited about using your app again. 

This is because downloads are not the only KPI worth considering. In fact, up to 25% of apps that are downloaded to a phone are never opened and up to 20% of users will use a newly downloaded app just once. These numbers can seem daunting but there are methods for maximizing retention. Apps that used remarketing, saw an 85% uplift in long term (12 weeks) retention


Keep the content coming

So, while acquisition is an integral part of any marketing strategy, retargeting and re-engagement must also be carefully considered. In-app gamification, emails and push notifications are all ways to reach existing users, but in this post we will focus on reconnecting via social media.

Re-engaging users allows brands to capture audiences’ attention when they are in a receptive mindset — on social media. Twitter, in particular, is perfectly suited to being a source of continuous information. 

Unlike other social media platforms, Twitter users are more eager to receive — rather than share — information and regularly visit the site to learn something. In fact, research has found that 79% of Twitter users learn something new when they visit Twitter. 

For example, Twitter’s conversational power introduced users to services like M-Pesa, an African innovation and mobile money service that has driven double digit growth for Safaricom in Kenya.

Furthermore, the platform can be an effective way for a brand to cultivate a community that benefits from two-way communication rather than simply broadcasting branded messages to consumers. 

Take 22Seven, Old Mutual’s budgeting app. It regularly posts on its blog covering topics such as how to diversify investor portfolios, economic trends and how to get the most out of your investments, to name a few. In these posts, it often links to the company’s Twitter profile.

Twitter creative examples for fintech

The power of Facebook 

As social media’s biggest player, Facebook has powerful tools for keeping users engaged through its app engagement ad campaigns. 

App engagement ads target people on mobile devices who have already installed your app in order to get them to open your app or take a specific action within your app, such as a purchase or complete a new level in a game. 

Another area where Facebook shines is through it’s ownerships of Instagram – the platforms have 100 million and 10 million active users in Sub- Saharan Africa respectively. The social media giant can attract potential users on both platforms with a single campaign. For start-ups who need to grow their customer base early, accessing large networks of users is essential. 

In capturing the attention of this audience through an integrated campaign, app makers have access to an increased number of ad formats. Facebook Video Ads draw people in with immersive creative, while Collection Ads Encourage shopping by displaying items from your product catalogue. A collection ad in Facebook News Feed includes a cover image or video followed by four product images.

When someone clicks on a collection ad, they’ll see an Instant Experience, which is a full-screen landing page that drives engagement and nurtures interest. These Instant Experiences can be created via templates offered by Facebook or customized to suit individual brand needs. Brands can also make use of Carousels and Story Ads, which are available on both platforms.

Facebook app ad creatives

Make measurement a habit

Once the right platform has been selected, the copy tweaked and the creative approved, and the campaign is finally live, the last link in the social media marketing chain is measurement: how brands measure the effectiveness of campaigns and what truly sets digital marketing from other forms of advertising. 

Only in digital marketing can you accurately attribute sales and many other consumer actions directly to the ads you serve on social media. By simply adding lines of code (or tags) to your campaign you can start measuring your conversions immediately.

Measurement can also occur across devices. Using Twitter as an example, if someone views a Promoted Tweet on one mobile device and then completes an app download on another, the conversion will still be accurately attributed to your campaign. This will apply to other social channels as well. 

Measurement and attribution are essential for a number of reasons from refining your targeting methods to analyzing at what point, if any, your consumers fail to complete the journey. Are consumers clicking through to your website, but not downloading the app? Have they downloaded the app, but are not engaging with it?

From its price and flexibility to its sheer ubiquity, social media is proving more and more to be an essential tool for marketers in Africa. Professionals from across sectors will increasingly look to social media to bring value to customers and brands.

The post Navigating Fintech in Africa: Driving app downloads in the age of social media appeared first on AppsFlyer.

Immediate fraud risks within iOS 14 and SKAdNetwork

$
0
0
Mobile attribution fraud iOS 14 SKAdNetwork

Within the general feeling of confusion and uncertainty surrounding SKAdNetwork, one question remains unanswered – is there a risk of attribution fraud with Apple’s new attribution protocol?

Apple has introduced several anti-fraud mechanisms that are meant to obstruct different types of attribution manipulations. All transactions that are tied to an SKAdNetwork event are cryptographically signed and verified by Apple in order to prove that the postback is attached to a known conversion event by Apple. The postback includes a unique transaction ID (a unique identifier for a transaction, such as a purchase or re-download) in order to detect replays of valid conversion events.

The mechanisms above are meant to validate the postback’s authenticity, but neglect to address the user’s interaction authenticity (impression or click).

Can these mechanisms be bypassed? And can fraudsters find creative ways to work around these limitations while being unnoticed?

To answer the above, let’s break down the possible attribution fraud scenarios in SKAdNetwork:
Manipulating a postback before it reaches the advertiser:

  1. The signature and transaction ID mentioned above are meant to treat such cases. However, both the signature and transaction ID can be bypassed.
    Example: The conversion value is not part of the signature, and the transaction ID can be used repeatedly (hoping that whoever’s on the other side doesn’t store all historical transaction IDs forever).
    The only real solution for this is sending the postback to its real owner – the advertiser.
  1. Manipulating Apple with a wrong attribution decision at the device level.
    The examples discussed throughout will display such cases.

We can say for certain that the SKAdNetwork attribution protocol provides limited  data for either measurement or optimization, offering only source app and campaign ID. 

Device interaction time indications are also unavailable. These indications are critical for measuring time frames between key events – mainly click time and install time. Without these indications, normal user behavioral trends (very difficult to emulate at scale with bots) can’t be constructed – eliminating indication of abnormal behavior. 

But, as we try to identify potential loopholes that might be exploited for fraud, we approached the issue from another direction.

Imitating potential fraudulent behavior can help us construct the fraudster’s manipulation path, and in-turn allows us to analyze and identify potential weaknesses as we try to protect our advertisers from such fraud.

Fake install farming

Anyone with one or more devices can click, download, engage with apps, and reset their device ID to make it seem as though it is a different device. This, in a nutshell, is a device farm. Once a VPN solution is introduced the fraudster’s IP address can also be altered or hidden. 

Can this be carried out with SKAdNetwork?

The short answer is yes.

SKAdNetwork may have eliminated the use of IDFA but a user’s Apple account ID is still used for measurement purposes.  

Resetting the Apple account ID is something that can be done programmatically through various tools and services, thus generating multiple fake users from one device is very possible.

Moreover, when using a jailbroken device you also eliminate the need of using a publisher app, as you can generate fake clicks without one.  

The SK protocol logs all clicks in an internal device database. With the right technical knowledge, one can easily create a fake app-like environment which connects to the ad-network’s server to attain its unique signature and campaign details. 

This fake app environment can then insert the click details into SK’s database – leaving iOS tricked into thinking that the click was delivered by a real app.

iOS 14 SKAdNetwork attribution fraud

iOS 14 SKAdNetwork attribution fraud

Jailbroken devices also give fraudsters the ability to programmatically control the SK timer through this fake app environment, meaning postbacks can be sent within 20 or 30 seconds, rather than the expected 24 hour window. Since this timer manipulation occurs on the device, at which there’s no device time data to work with, the advertiser cannot tell whether timing was tampered with. 

The above manipulations explain that device farms can operate at scale, without any ongoing human interaction.

Flooding the gates

Click flooding is meant to “flood” the advertiser with a wave of fake click reports, in the hopes that one of these clicks will be somehow associated to either an organic install (when a user downloads the app on their own), or a non-organic install (a click that is artificially injected after the user has viewed an ad from another publisher).

SKAdNetwork attributes credit for installs that occurred through the Apple App Store. When a user views an ad on a publisher’s app and clicks it, the app’s in-app store page will appear within the publisher’s app.

This App Store page view is registered as a click by the SK protocol.

Once the user downloads the app from the App store page and launches it, the install will be attributed to the publisher’s app.

How can this flow be manipulated?

Our tests show that publishers can simply trigger the advertiser’s App Store page to appear without a user’s ad click, thus creating a fake click report.

The app store page can be triggered repeatedly without a single ad click, creating a similar effect to click flooding. This is very similar to common manipulations where ad impressions are falsely reported as clicks.

How is this affected by Apple’s recent view-through addition?

With Apple’s latest addition of view-through to the SK protocol, flooding might even become easier. A click-through flow can theoretically be validated by Apple by checking the entire flow (click→ App Store → Install).

However, with view-through attribution, as we eliminate the click from the equation, this flow validation cannot occur. Anyone can theoretically claim to deliver impressions, hoping for installs to be attributed.

With SKAdNetwork, publishers can determine an impression’s start and end times. While Apple’s official statement says that this time frame should be over 3 seconds, It is not enforced in any way. This means publishers are free to generate fake impression reports, generate an impression flood, taking advantage of view-through flows.

An even simpler way to take advantage of view-through attribution is using the device database access mentioned above to insert false impression reports – making sure the publisher is always the one to provide the last impression.

This opens the possibility of creating either click flooding or impression flooding, by programmatically triggering click or impression reports. 

While the App Store page pop up is hoping to initiate an actual install from the user who sees the page, all other manipulations simply hope to steal the credit for an organic install that had nothing to do with any exposure to an ad or app page.

Our tests show that even installs that take place up to 24 hours post click-report receive attribution credit from SKAdNetwork. Apple’s official documentation actually discusses a 30-day lookback window, increasing the likelihood of such a scheme to be successful.

Malicious source apps like the ones described above can still be identified and treated by Protect360 using different detection methods. The behavior outlined above will still deviate from standard behavioral trends when viewed on a large enough database scale, even within the aggregate nature of SKAdNetwork.

We’re just getting started

As we enter a new era of attribution measurement, we’re very likely just scratching the surface in terms of possible fraud methods and manipulations.
AppsFlyer is working in cooperation with Apple and the ecosystem at large to raise these issues when they occur, as we work hard to maintain a fraud-free environment in this new era of attribution.

As fraud researchers, it’s now our job to continue diving deeper into possible areas of weakness and identify how they might be exploited, so that we continue to adapt and protect our customers.

Stay tuned for more developments.

The post Immediate fraud risks within iOS 14 and SKAdNetwork appeared first on AppsFlyer.


Introducing SK360: Supercharging SKAdNetwork with predictive analytics and fraud protection

$
0
0
Introducing SK360: Supercharging SKAdNetwork with predictive analytics and fraud protection

AppsFlyer’s SK360 delivers full coverage for SKAdNetwork measurement, from conversion value mapping to fraud detection and predictive LTV analytics.

We’ve spent the last 9 months developing solutions to empower customers to grow in a post-iOS 14 future. An important piece of this solution is innovation for SKAdNetwork, one of the critical tools for iOS ad campaign attribution. 

Today, we’re happy to share AppsFlyer’s integrated suite for SKAdNetwork – SK360. SK360 gives advertisers full coverage for every aspect of SKAdNetwork attribution, from integrating with partners, to campaign optimization, fraud protection and even predictive analytics.

AppsFlyer’s SK360 delivers full coverage for SKAdNetwork measurement

The next generation of SKAdNetwork innovation

Over the last few months, we’ve introduced some of our solutions for SKAdNetwork. Today, we’re excited to introduce two more key functionalities for SKAdNetwork, empowering advertisers to take their iOS campaigns to the next level.

Predict 

One of the biggest challenges advertisers face with SKAdNetwork is the timer mechanism. Measurement is limited to specific activity occurring in the first 24-72 hours of activity. How can advertisers make critical campaign decisions based on such limited data?

AppsFlyer’s first-to-market PredictSK solves this very problem. PredictSK enables advertisers to leverage early signals of engagement and predict long-term campaign performance to make timely optimization decisions. With PredictSK, advertisers can continue measuring unlimited in-app events to predict the expected LTV of each user. Advertisers can dedicate the 6 bits of their conversion value to LTV prediction, instead of “wasting” their precious conversion value bits on static events (that may or may not provide a good proxy to campaign ROI).

AppsFlyer Predict dashboard

There is no guesswork or crystal ball in this technology; it is all built upon big data, machine learning, and our deep analysis capabilities of each app’s unique usage patterns. The result is an exceptionally accurate prediction model, based on each app’s specific insights. This model not only ensures accurate prediction per each app, but also data compartmentalization: each model is siloed and built only upon the data from that specific app.

PredictSK is a brand new product, and will be released as a premium feature to AppsFlyer customers this Spring. We’re excited to share in this journey, and invite customers to sign up and stay up to date on the progress of PredictSK.

Want more updates on Predict for SKAdNetwork?

Protect

Apple has introduced some postback cryptographic verification processes for SKAdNetwork, designed to prevent postback manipulations only. These mechanisms do not address the authenticity of the end user’s interaction (impression or click), and leave the gates wide open for ad fraud like click flooding and device farms.

Malicious SKAdNetwork activity is easy to miss, and is hardly ever visible to the naked eye. Behavioral anomalies are even harder to detect with limited available data. AppsFlyer’s Protect360 suite detects malicious ad activity, thanks to the massive scale of data measured on a daily basis. The multiple attribution models AppsFlyer uses for measurement, make it possible to identify anomalies and fraud indicators can be identified even in an aggregated data reality. The combination of different detection methods coupled with continuous anti-fraud innovation, means that advertisers’ marketing dollars are still safe – even in the new iOS reality.

These two exciting capabilities are part of the 5 building blocks of our SK360 suite, three of which we’ve released and continue to evolve.


Connect

We’ve always prided ourselves in being the centralizing force that connects advertisers with the ecosystem. We have worked hard to uphold this position, enabling our customers to choose, connect and integrate seamlessly with their partners.

Our growing list of SKAdNetwork integrated partners includes key industry players, such as Facebook, Twitter, Snap and ironSource; we’re actively working on integrating many others. All partners deliver postbacks directly to us, allowing advertisers to focus on what’s truly important – their own success.


Optimize

We’ve taken conversion value mapping and made it accessible, easy and intuitive. It can all be done right in the self-serve configuration menu. You can tinker and experiment with it as much as you need, segmenting and splitting user attributes to achieve the optimal schema.


Analyze

Our SKAdNetwork dashboards and APIs provide a comprehensive visual drill-down of critical performance KPIs, including CVR, ROI, CPI, ARPU, ROAS, eCPA. The data updates in real-time as postbacks are delivered, providing full-funnel insights based on media source and campaign.


Facing the future with SK360 

We’re excited to be leading this first-of-its-kind solution to one of SKAdNetwork’s biggest pain points. With the full SK360 package and PredictSK included, the ability to get LTV measurement is no longer in question. Advertisers can reap the full benefits of SKAdNetwork’s deterministic attribution, without suffering the inherent disadvantages in its design.

The post Introducing SK360: Supercharging SKAdNetwork with predictive analytics and fraud protection appeared first on AppsFlyer.

Machine learning in a digital age: The future is now

$
0
0
machine learning in digital marketing: the future is now (featured)

Machine learning is one of those buzzwords that is often used, and sometimes abused… 

Don’t get me wrong, it’s a super powerful tool in the age of data, but what does it really mean? And what does it actually deliver for digital and mobile marketers in particular?  

In the most basic terms, machine learning is the application of Artificial Intelligence (AI) that enables a system to autonomously learn. AI attempts to simulate human intelligence, whereas machine learning pulls from past data and independently applies it to the performance of tasks. Over time, and with ever-increasing volumes of data, the machine is able to learn from previous tasks and improve the accuracy for decision making and predictions.  

In digital marketing, machine learning algorithms can help understand trends in user behavior so that we can predict how valuable these users might be over time.

With the introduction of iOS 14 and its attribution limitations, the importance of predictions to enable app marketers to be equally effective rises significantly. 

Machine learning also plays a key role in audience segmentation, personalization, media buying, creative optimization, and process automation. 

In this blog we will explore the role and value of machine learning in digital marketing and specifically mobile app marketing, while providing specific use cases and relevant examples.

I predict you will benefit from this post, so let’s get started. 


Table of contents


Intelligent, data-driven analysis in digital marketing

One of the key characteristics of digital marketing is the collection of data for campaign optimization.   

Since all marketers collect data and are able to carry out some form of analysis, where they differ is in their ability to apply this data intelligently. That means investing in the right tools, the right infrastructure, and the right team (especially data scientists) to draw meaningful insights that actually drive business growth.

But data is only a means to an end, and basic analysis, such as CTRs, CTIs and CPAs are no longer sufficient. Advanced tools such as predictive analytics and machine learning are needed to take data and decision-making to the next level. 

One such advanced use lies in the opportunity to take this data and apply machine learning techniques to predict consumer trends, providing marketers with a powerful layer of intelligence that enables smarter decision-making. 


The marriage of past actions to future predictions is a major reason why machine learning is such a game-changer for digital marketers. We’ll expand more on this point further down in the post.


The advantages of machine learning in digital marketing 

There are many ways to leverage machine learning in digital marketing to make the most of your data:

Improved user segmentation

Digital marketers have the ability to learn about their customers over time by granulary measuring their activities. A mobile app may have 200+ metrics available for measurement, but a typical marketer will probably measure a maximum of 25. A machine, on the other hand, is able to ingest all of that information in a matter of seconds and apply it to marketing efforts. 

Advantages of machine learning in digital marketing

Let’s take an example:

An eCommerce app has tens of thousands of active users per day. With machine learning, a campaign manager will be able to predict, based on previous behaviors, which users are likely to purchase what next, and when. 

Consider that power of knowledge. Armed with this info, the marketer could create a perfectly crafted campaign, meeting exactly the right users at exactly the right time. 

Using indicators such as previous purchases, frequency of purchases, time of day, demographics, funnel progression, etc. the algorithm is able to cluster more general audiences and segment them into highly granular, mutually exclusive audiences for more effective targeting and messaging, and ultimately a better Return on Ad Spend (ROAS). 

A more personalized customer experience

With improved segmentation comes the ability to deliver a more personalized experience. 

If you know where your customer is in the funnel then you can serve them with the ad that is best suited to their stage and their preferences. 

When users are in the app, machine learning can use data such as search history and typical actions and pair it with behavioral data and search requests from similar users to suggest more products or services. 

For example, a clothing app will likely know a user’s gender (assuming women view women’s clothing items and vice versa), previous purchases and how much they typically spend on an item. Coupled with information such as season and location, the algorithm brings all of these factors together and suggests items that can be used in re-engagement creatives for a more personalized experience. 

Creative optimization

Knowing the optimal location, color, size, etc. of a CTA button or an image is something that we can experiment with using A/B testing. However, this is usually limited to one variable. Machine learning allows marketers to test multiple variables at any one time and offer insights on which was the most effective. 

For example, a marketer may have dozens of campaigns running simultaneously, all with at least 10 different elements in each creative asset. Understanding which combination of elements, for example, colors, location on page, text, numbers of words in the CTA etc requires a machine to be able to analyze all of the possible combinations and offer insights into what delivers the best results. 

Automation of processes

Process automation with machine learning in digital marketing

Machine learning is not just about the ability to better target users. At its core, it is about learning to perform tasks without human oversight. A marketing campaign is full of processes, many of which are hands-on, mundane, and repetitive. 

By automating these tasks, marketers free up time to focus on issues which require human intervention. The net result is a more streamlined and efficient process, fewer human errors, and more capacity for marketers to deal with complex and strategic tasks. 

For example, campaign managers often run dozens of campaigns at any given time. They typically start their day by looking at a dashboard of data and assess which campaigns are running well and which are not, and adjust their marketing efforts accordingly. What they are relying on to optimize their campaigns is mostly based on their own experience and intuition. 

Automation achieved through machine learning, however, can be used to better optimize campaigns. Algorithms are able to rapidly and accurately process and analyze campaign data and trigger notifications when certain trends or unusual spikes occur. These alerts are essentially insights with which the campaign manager can decide whether to stop, adjust, or double-down on their marketing efforts. 


Putting machine learning into action 

The impact of machine learning goes far beyond these advantages, and is in fact a major influence to mobile marketing efforts as a whole. There are numerous examples and use cases but let’s explore some of the main ones. 

Ad fraud

Fraud has and will continue to plague the web and the app world. It is estimated that $1.6 billion were exposed to app install fraud alone in H1 of 2020 (the amount of ad spend that would have been lost to fraud had there not been any protection in place). Outsmarting the fraudsters is a never-ending challenge. 

Machine learning is a vital tool to effectively and efficiently combat fraud by analyzing common user behavioral trends using these insights to highlight any activity that might deviate from these trends. 

While no human can simultaneously compare data trends across dozens of device indicators, engagement and timing trends and spot the odd bird, a machine can do so in a matter of milliseconds.

Moreover, the larger the available data set is, the faster the machine can identify existing and new fraud trends as they emerge. The machine can block them with greater statistical significance and confidence.

Chatbots

Delivering a superior customer service is also a major goal for most businesses, and app owners are no different. Chatbots are computer programs that can engage people in human-like conversations, and the most advanced versions are driven by machine learning. In their most basic form they offer the opportunity for 24/7 customer service. 

More advanced machine learning driven bots can help customers complete purchases and answer FAQs. You can reduce your customer support costs, having the bots escalate any queries the algorithm can’t answer. 

Autodesk, a 3D computer-aided design company used their bot, AVA for precisely this purpose. Their bot responds to simple tier 1 queries such as address changes, payment issues, and login issues anytime of the day or night. Their bot service improved their response times by 99% and dropped the cost per query from $15-$200 (human customer service agents) to $1. The bot has 40+ conversations it can effectively resolve and all other issues are escalated.  


Chatbots: machine learning in digital marketing Source: “How chatbots can help reduce customer service costs by 30%” from IBM Watson Blog

Taking it a step further, digital marketers can enhance their interactions with customers by using data from chatbots to deliver a more personalized experience to their users. For example, using the information generated during a conversation with a chatbot to inform a remarketing campaign.

Dynamic pricing

Travel apps want to know they are pricing their products and services at the market rate. For example one hotel booking app will not want to price the same hotel room much higher or lower than their competition. Dynamic pricing uses machine learning to monitor the web and ensures that the price you are quoting is the correct market value at that moment in time. 

Additionally, it can also predict which users may be close to purchasing and offer timely discounts. Such discounts can be limited to those who are close to converting, but require an extra incentive. This way price cuts can be offered in marketing campaigns on a limited basis and to those who would not otherwise convert. 

User acquisition

Media sources, with their vast scale of data, are able to leverage machine learning in user acquisition campaigns for app marketing. For marketers, it’s important to understand how your media partners are leveraging machine learning in an effort to optimize your campaigns. 

Facebook developed a tool called Automated App Ads (AAA) which, by using machine learning, allows marketers to test audiences in a quick and efficient manner. They can test keywords or creatives and analyze the results to see which ones received the best conversion rates. 

The Google App Campaigns (AC) product uses machine learning to analyze hundreds of signals in real-time so that your app appears in front of the user most likely to convert. AC also uses this technology to optimize bids across Google’s properties. It does this by taking campaign types, in-app events, and in-app conversion values and incorporating them with other variables such as copy, creative, budget, KPIs, and a bid. 

Google then takes all of this information and, using machine learning, tests it across its properties including, search, Google Play, Discover, the Google Display Network, and increasingly, YouTube, serving the ads which are performing the best. 

Ad networks, DSPs, and exchanges, as well as mediation platforms and other sell-side players also leverage machine learning in programmatic campaigns, particularly ones that involve real time bidding. 

Understanding customer behavior

Finally, and crucially for app marketers, machine learning is an excellent way to understand customer behavior. We mentioned it briefly before but the ability to predict how a customer is likely to behave based on their previous interactions is an incredibly useful tool to marketers. Let’s explore this concept a little further. 


Predicting customer behavior

App marketers have a sea of data available to them, not all of which is utilized. However, with machine learning they can leverage past performance trend analysis to construct a solid prediction for future trends and even a customer’s next action. 

Hypothetically, a machine can know, for example, that a user who completes a tutorial and passes three levels of a game in their first day post install is more likely to purchase tokens. Having this knowledge can help app marketers decide early on whether to optimize a campaign, kill it, or increase spend.

We have mentioned that the more data the machine has the better the assumptions it can make. Only once there is sufficient data and a certain confidence level is reached can this assumption be considered a prediction. It is important that the prediction is delivered at the right moment so that the marketer can act on the insight before they lose the opportunity to create value from it. Too little data and the assumption may be incorrect, wait too long and you may have missed the moment to optimize. 

Therefore tight integration with data-rich dashboards, such as in-app events, which best reflect a customer’s LTV pattern will enable a prediction algorithm to deliver faster, more accurate results. 

Your attribution partner is perfectly positioned to provide such data and as such helps build the picture of how well a campaign is performing. Having an attribution provider that has machine learning built into its system will enhance this already smart solution. 

Think of your attribution data as the infrastructure to your marketing campaigns. Your attribution dashboards are home to vast quantities of data and are constantly acclimating more. The ability to predict what a user, or a group of users, may do next is a significant advantage when assigning budgets and resources. 


Understanding insights from predictive analytics

Marketing analytics help to deconstruct the data by highlighting trends and delivering insights so marketers can gage which users are the most valuable and which channels are the most profitable.

The process of understanding the data and generating insights can take a number of weeks, or even months. Predictive analytics help to cut the campaign learning period by using existing integrations to provide an accurate campaign LTV prediction. 

By leveraging machine learning and understanding the existing user-level information, predictive analytics could feasibly deliver a campaign score within days of its launch, telling the marketer how successful it is likely to be. With this information, the marketer can either cut the campaign, optimize where required, or double down giving them the ability to make a fast pause-boost-optimize decision. 
Machine learning in digital marketing: Predictive analytics example

The SKAdNetwork challenge

The challenge comes with the introduction of iOS 14 and the use of the SKAdNetwork which aims to create a more privacy-centric environment, and limit the measurement of user-level data in the iOS ecosystem.

For Android and those that opt-in to IDFA measurement, traditional attribution is still available. Data is available much faster and on an on-going basis, so marketers are able to optimize without necessarily using predictions (though using predictions is always advised and used by the savviest marketers).

However, in iOS 14, the quantity of data is severely limited. The SKAdNetwork allows only one postback per campaign and so there is a limit not only on the volume of data, but also the time in which the marketer has to be able to make decisions on whether a campaign is likely to be successful. 

When you compare the capabilities of traditional attribution models to what is possible in the SKAdNetwork you see how vitally important machine learning is for app marketing. Machine learning algorithms can quickly learn and most importantly, predict, which campaigns are likely to deliver the most valuable customers. 

Beyond the limit of one postback per campaign, there are other limitations to the SKAdNetwork including a lack of real-time data, no ROI or LTV data as it mostly measures installs, and a lack of granularity as only campaign level data is available (and that is limited to 100 campaigns). Additionally, there is a 24-hour, and sometimes longer, post-back delay and there is no re-engagement attribution support. 

So the question really is, in this post-iOS 14, SKAdNetwork reality, how can you deliver relevant advertising without knowing what action each user is performing? 

Enter machine learning, which will enable ad networks to continue to provide value without having to create intrusive user profiles.

One way can be by using statistical estimations and previous data to predict future actions. Marketers can also run experiments using non-personalized parameters such as the contextual signals mentioned earlier and train their machine learning models on what was successful and what wasn’t. The results are then applied to future campaigns and further refined as more data is collected.  


The future of ML is now 

Machine learning isn’t going anywhere. In fact, its abilities are only getting stronger. There is a concern that these algorithms will take over some roles, and this may be the case, but they will likely be repetitive, time-intensive, mundane tasks that marketers don’t enjoy. The flip side of this is that it will free up resources and time to be used on more critical tasks which require human intervention. 

One example of this are the creatives. A machine may be able to make keyword predictions but it can’t develop a nuanced idea or design the creatives to go alongside a campaign. There are some aspects of digital marketing where the human touch is still vital and creatives are an example of this. 

With the introduction of iOS14 machine learning will be an extremely important tool for marketers who will need to demonstrate that data driven marketing can still thrive in the age of privacy. 


Key takeaways 

Although the application of machine learning within mobile marketing is still in its infancy, it is certainly here to stay. AI and machine learning have already made a significant impact on marketing analytics and we predict this is only the beginning of the journey. 

Let’s summarize what we have learned: 

  • Machine learning enables smart decision making using historical data to predict future trends
  • There are many examples of how machine learning can be applied to marketing efforts including: 
    • Audience segmentation
    • Combating fraud
    • Delivering a superior customer experience
    • Improved user acquisition 
    • Ability to dynamically price products
  • Machine learning can help us understand customer behavior in less time and enable marketers to predict future trends and actions faster and more accurately 
  • Machine learning will be a critical tool in the post-iOS 14 era as the quantity of data and the time marketers have decide the value of a campaign are severely limited. The ability to predict trends based on the data available will therefore be critical to marketers going forward.  

Finally, the more data we have, the smarter and more precise the predictions become. Of course there will be some aspects of mobile marketing that machines will never be able to replicate, but the more we embrace the capabilities of machine learning, the smarter we as marketers become. 


The post Machine learning in a digital age: The future is now appeared first on AppsFlyer.

5 reasons web-to-app should be on your radar

$
0
0
5 reasons web-to-app should be on your radar featured image

During 2020, with the enforcement of iOS 14 privacy regulations on the horizon and a noticeable rise of web touchpoints in user journeys, AppsFlyer redoubled its investment in web-to-app funnels. Enabling customers to benefit from web-to-app has, of course, come alongside our continued efforts to provide airtight security and privacy and innovate on the attribution front to mitigate the impact of Apple’s iOS 14 announcements on customers.

In a recent blog, we showed how and why the web is becoming more important as a funnel touchpoint both for users and advertisers. That blog introduced five reasons that advertisers are showing more interest in the web. In this blog, I’ll provide more details on those five points.

What is web-to-app?

But before I elaborate on the five points, let me define what we mean by web-to-app. Web-to-app describes the journey – often direct – taken by an end-user from an advertiser’s website to their app. 

It’s worthwhile showing a typical web-to-app journey involving web banners to make things clearer. Web banners, such as Smart Banners, allow brands to display sleek content and creatives on their mobile site that ultimately encourage users to download the app.

In very general terms, there are two Smart Banners user flows:

  • An existing app user clicks on the banner and is sent to in-app content directly, accomplished with deep linking.
  • A new user experiences what is known as deferred deep linking. She clicks on the banner, proceeding first to an app store to download and install the app before heading to the right in-app content.

As you can see from the flow below, the user journeys from a mobile website to an app, hence web-to-app (W2A). This W2A flow demonstrates high conversion, our customers experiencing average click-through rates of about 4.5% and conversion (click-to-install) rates of nearly 30%.

Web-to-App_Smart_Banners

And Smart Banners are just one example of a W2A tool working well for our customers’ acquisition efforts.

Why web and web-to-app are so relevant for advertisers

We all know that mobile devices play a huge role in our daily lives. We use our mobile devices to socialize, pay our bills, play games, snap photos, arrange our schedule, and even to make a call now and again. 

And in contrast to the predictions that mobile web usage will become less important to advertisers, installs with web touchpoints nearly doubled during 2020. Though this trend was evident even prior to COVID-19, the pandemic made the importance of the web even more pronounced.

Among apps that were live throughout the measured timeframe

We see this across various industries and regions; and we see it across businesses of different sizes. 

We’ve also observed our more advanced customers respond by using existing web campaigns and trying to engage with users to download the app when they enter their mobile site. Still others have created landing pages in order to better engage with web traffic.

These forward-looking customers are onto something. They “feel” the shift that the market is making to the web and are responding with different web-to-app flows. 

When we boiled down what these brands are thinking and doing, we concluded that web-to-app (W2A) is top of mind for five reasons:

    1. Reducing costs – The app advertising market is more challenging and competitive every year, and the cost of app user acquisition is increasing. Advertisers are utilizing W2A in order to achieve a cost-effective acquisition funnel, compared to the standard funnels they are currently using. W2A allows them to explore new funnels that have been untouched till now. In some cases, they’re finding costs for web acquisition to be less than app acquisition.

      In addition, the imminent deprecation of IDFA will make other channels more difficult, and therefore more expensive, to measure, making the web a more attractive channel for marketers to tap.
    2. Retaining visibility – Advertisers using social ad networks rely on IDFA to acquire iOS attribution matching. But once the IDFA guidelines take effect, social ad networks, AKA self reporting networks (SRNs) such as Facebook, Google, and Twitter, will be limited in their ability to match the user who clicked a specific ad with the user who downloaded and opened the app for the first time.

      This means that advertisers will lack accurate attribution when it comes to SRN campaign performance. In addition, they will not be able to use deferred deep linking for users coming from SRNs in their UA efforts. And while they will be able to use SKAdNetwork, it will provide limited visibility. SKAdNetwork will not offer accurate enough attribution and will not support deferred deep linking, since it is not a real-time solution (there is actually a 24-48 hour delay).

      On the other hand, with W2A campaigns, advertisers can direct users to an owned mobile site, and from there to the app and retain measurability. W2A campaigns allow advertisers to attribute users in a highly accurate way, in real-time, and to support deferred deep linking, even without changing the app code. That means there is no need to submit an updated app to the store.
      5_reasons_for_web-to-app

    3. Increasing retention – We’re noticing a trend: users install apps only after fully understanding a product’s benefits and offering, especially in the travel, ecommerce, and food & drink verticals.

      This extended pre-install journey involving W2A funnels allows the advertiser to present the user with their value proposition. Users can explore the site and understand “the why”, in other words: “Why should I download this app instead of another similar, alternative app?”

      The extended journey which involves prolonged browsing, exploring, and discovery result in two main benefits for advertisers:

      1. Conversions – Users arriving to mobile websites can be educated and incentivized to download the app, leading to higher conversions.
      2. Loyal users – Because users understand “the why” of your app and how it is superior to a competitive app, you increase their loyalty to your app and lower their chances to churn.
    4. Leveraging web onboarding Some businesses prefer that users register, subscribe, and sometimes even pay on the web, before driving them to the app. This is especially common among streaming and media apps.

      This is a classic and very valuable W2A funnel because it allows advertisers to keep track of the acquisition funnel and understand where a user came from. For example: if a user arrives at your site from a PPC campaign, you can send them to the user acquisition funnel in the mobile site. Once the user downloads the app (at the end of the mobile web journey), you will be able to attribute them to the initial PPC campaign.

    5. Expanding reach – When targeting potential app users in campaigns, an ad network creates an audience group for an app campaign — let’s call it “Group A.” The ad network will target “Group A” and display ads with which they would like the group to engage. Now, the ad network can also run a “web campaign” and create a different group — let’s call it “Group B”.

      By running both the app campaign and the web campaign, the ad network will be able to target a larger total audience that includes both Group A (app campaign) and Group B (web campaign).

Wait, isn’t this another step in the funnel?

I’d be remiss if I didn’t address a question many marketers ask me: isn’t this funnel longer, requiring at least one more click and a “detour” through a website? 

It’s a good point, directly related to the concept of extended pre-install journeys mentioned above. Yes, it’s true that the journeys are longer. But, in fact, for more advanced, goal-oriented users, it is a much more effective funnel for increasing conversion rates and overall ROI.

As mentioned in one of the five points above: High-intent customers require compelling reasons to install your app, and these reasons should come sooner in the funnel. 

Subscribe to AppsFlyer content

The latest mobile marketing tips & trends delivered to your inbox.

An advanced W2A use case with paid campaigns

Advertisers don’t necessarily have to create a dedicated W2A campaign. They can use existing campaigns intended to drive users to your app store. 

In this more advanced use of W2A, advertisers can “piggyback” on existing web campaigns by: 

  • Adding W2A “tools” (such as Smart Banners) on the user journey that encourage users to download the app. 
  • Adding parameters to the URL used in the existing web campaign. 

I hope to provide more information on this flow soon after we gather input from our early adopter customers.

What’s next?

Given the compelling reasons for using W2A, we expect these funnels to become more and more common. And we expect brands to come up with innovative ways to connect social networks as a critical touchpoint in web-to-app funnels.

The post 5 reasons web-to-app should be on your radar appeared first on AppsFlyer.

Unbiased, independent, and the future of the ecosystem & web

$
0
0
Unbiased, independent, and the future of the ecosystem & web

Following a very intense year, packed with uncertainty and change, I’d like to re-share our mission and re-emphasize our commitment to our community. I hope it’ll give you one less thing to worry about, especially during these uncertain times. 

In our industry, it isn’t always clear who is representing whose interests. This mystery initially caught my attention a decade ago and is one of the main reasons we started AppsFlyer. 

Being independent and unbiased is not new to us. They’ve been AppsFlyer’s core principles from the start. We’ve been consistent about our position, officially committing to it back in 2015 and 2018.  Representing the app developers and marketers in this ecosystem is the single most important factor for our success. 

While other companies might have leveraged conflicts of interest to boost revenue, staying independent and unbiased is the foundation of our customer-obsessed culture and the basis of maintaining our customers’, partners’, and the ecosystem’s trust. 

Trust that has enabled $40B+ worth of educated marketing decisions in the last year alone. Trust that has allowed us to deliver innovative privacy-preserving solutions like combining Predictive analytics and SKAdNetwork (PredictSK), SK360, Incrementality, web to app, and privacy-centric aggregated measurement solutions. Solutions that enable the entire ecosystem to focus on providing a great end-user experience and value, while maintaining the highest standards of privacy protection.  

Over the past few weeks, many app developers have been sharing their concerns about the recent consolidation of a media company, an app company, and a measurement platform. They’re concerned because their most trusted partner, who has access to their most intimate asset – their data, instantly became biased, introducing significant risk to their business. I empathize with them. With iOS 14 quickly approaching, this is the last thing they should be concerned with.  

On behalf of the AppsFlyer board of directors, management, and employees, I can wholeheartedly guarantee you this will not happen with AppsFlyer. We are committed to staying independent and unbiased forever. We’re in this for the long haul. Making such a move is short-sighted and would completely betray your trust, and the relationship we’ve been building with you for almost 10 years. 

For the last few years, we’ve been using a simple decision-making framework for every decision we make at AppsFlyer:

  1. Is this good for our customers, and their end-users?
  2. Does this make me proud to be part of AppsFlyer?

This framework is essentially the basis of our culture and every decision we make. It guarantees our core principles are always at the heart and soul of every decision we make, as a company or as individual team members. It ensures we consistently maintain your trust with every new decision.

We see ourselves playing a big role guiding the industry into the future. It’s crystal clear to us we’ll only be successful if we uphold your trust and stay true to our core values.

Now is the perfect time to reaffirm our commitment to you.


To our customers:

Independent and unbiased are not just words we push into our sales and marketing materials. They are critical, core parts of our DNA. They enable us to be genuinely customer-obsessed and laser-focused on our ultimate goal of making you more successful. 

In light of recent events, you may want to ask yourself a few questions. Would you give a competitor your paying clients’ contact information? Can your attribution ‘partner’ target your clients with a similar offering? Do they have an app business that competes with yours? Do they have the potential to become a competitor? Are they positioned to help your competitors at your expense? This may sound far fetched, but it is not.

We’re committed to:

  • Remaining independent and unbiased. 
  • Avoiding conflicts of interest, and always representing you, and you alone, in this ecosystem. 
  • Providing you with the leading privacy-preserving software and safeguards to help you maximize your end-users’ privacy. 
  • Protecting your data. We’re a cloud based CRM-like software, where you have full ownership and control over your data. We’ll never sell or exploit your customers’ data, or have any conflict of interest protecting our customers’ data. This is why we don’t have an app business nor sell media. 
  • Making your success our success. 

Thank you for your trust and for letting us protect and safeguard your most important asset – your data. Thank you for working together to overcome significant ecosystem challenges by building great solutions. Thank you for trusting that we’ll stay independent and unbiased. 


To our partners:

Imagine MMP saying the following, “We sell the best media, measure it ourselves, and will also build the best software to enable advertisers to spend their budget with our competitors.” 

You’d probably be confused because the significant conflicting interests are glaringly obvious.We’re committed to: 

  • Remaining unbiased. We won’t enter the media business and compete with our media partners. 
  • Protecting your data and insights. We have zero interest in selling media, building profiles, or building our own apps. 
  • Helping you educate the market about your innovative products.
  • Supporting you in discrepancies analysis and fighting fraud for the ultimate benefit of our customers and partners and industry. 

Thank you for investing in our partnership, valuing transparent measurement, and taking special care of AppsFlyer’s customers. We take great pride in the strong relationships we’ve created over the years, and in the deep technical integrations and products we’ve built to fight fraud, and deliver a great user experience while maximizing users’ privacy. 


To our ecosystem and community:

Having an independent and unbiased platform is critical to ensure that we, as an ecosystem, are constantly innovating to deliver the best end-user experience and preserving users’ privacy. 

When a media company acquires such a platform, we see it as a loss for the industry. Despite this, it’s an exciting time for us to continue paving the way for an unbiased and independent platform like never before. We’re excited and honored to take on this additional responsibility. 


So where do we, and the web, go from here?

What started as an open-web, has evolved over the past decade into a web of walled gardens. While we believe in the freedom, openness and safety of the internet, it is no longer truly open. With that, we have the power and the responsibility to collaborate across the entire ecosystem for the benefit of all of us – the users.  

As users spend time moving between various walled gardens, an industry-wide collaboration is needed to define protocols and APIs to enable a great end-user experience and provide value, as well as preserve privacy.

The fact that AppsFlyer doesn’t own any consumer product, browser, OS, device, app store, ad-network or any media affiliation gives our independent and unbiased positioning a whole new meaning. 

Our neutrality repeatedly placed AppsFlyer as the trusted collaborator and connector between these platforms, OSs, devices, services providers, ad-networks, app developers, websites, app stores, and the entire ecosystem as a whole. iOS 14 took these discussions to a whole new level, and we take this responsibility very seriously. We know that if we consistently work with the end user in mind, we’ll be ahead of trends and positioned to create a better future for everyone. 

I’m so proud to see more than 1,000 AppsFlyer employees waking up every single day and working towards this mission. I feel lucky to lead a company whose purpose and vision go far beyond making money; a company that knows the value of placing revenue secondary and the end-users, app developers, and ecosystem first.  

Our goal at AppsFlyer is pretty simple; to stand before each of you in five, ten, 20 years from now, and know that at every step of the way, we did the right thing for the entire ecosystem and most importantly, the end-user. 

oren-kaniel-signature-appsflyer-ceo

The post Unbiased, independent, and the future of the ecosystem & web appeared first on AppsFlyer.

Predictive marketing explained – why it matters

$
0
0
AppsFlyer predictive analytics: predictive marketing explained

The role of a user acquisition manager has drastically evolved throughout the years, becoming greatly significant with increasingly challenging tasks.  

UA managers often struggle to find effective ways to optimize their campaigns and obtain high-quality users. Many BI solutions and third-party technologies are typically used to try and determine user-cost, counter it with user LTV, and handle the overall uncertainty of user ROI. 

However, more often than not, a UA manager’s gut-feeling regarding a campaign’s potential is the real decision-maker, as sufficient decision-making data is often missing or lacking.


User acquisition optimization – how does it actually work?

Naturally, mobile app developers want to attract more users to their app. This can be achieved either organically or via multiple advertising channels and activities.  Acquiring paid users is typically accomplished by using advertising networks (Tapjoy, Unity, IronSource, etc.) or large publishing platforms (Facebook, Google, Twitter, etc.). Advertising campaigns consist of different user cohorts, which can be segmented by various demographics, geo-locations, publisher apps, and more.  

For example, an advertiser could try to reach users in the UK on Tinder (when working with traditional ad networks) or a category of women aged 20-34 who like gaming on Facebook. 

For each one of these targeted cohorts, the UA manager defines campaign attributes that include budget, daily impression cap, and most importantly, the bid price (the amount of money the UA manager is willing to pay per user, aka PPU).

Once a user installs and engages with an app, the UA manager monitors and tracks their entire user journey. During the user’s lifespan they will generate value through different types of KPIs: 

  • Monetization – revenue from in-app purchases, ad views, subscriptions, offer walls, etc. 
  • Engagement – user activity that represents app involvement and contribution to the app economy
  • Retentiona user’s app usage frequency and stickiness

The UA manager’s role is to ensure that the entire sum of values received per each user surpasses their cost. The main challenge is to accurately measure the user’s lifetime events, a process which can take anywhere from three weeks to twelve months, depending on the app.

AppsFlyer Predict KPI breakdown

Predict KPI breakdown

In a perfect world, determining a user’s cost would only be confirmed once their LTV is clear. Unfortunately, advertisers are required to pay upfront, causing significant uncertainty to a campaign’s management.


The LTV chase

Advertisers invest substantial resources in BI systems, dedicated teams, and utilize Data science to try and identify different points along the user journey, that only hint at user LTV. The more advanced the BI setup, the more likely the UA manager is to find closer proxy points. 

Such analysis requires roughly 7-14 days to accumulate sufficient data to generate an initial user LTV insight. To make these insights reliable and “clean”, no changes can be made to the campaign during this period. 

It’s only when a reliable insight is received, that a UA Manager can optimize each campaign, by changing bids, creative, or targeting.

The painful trade-off for this learning period is that insight accuracy increases the longer an advertiser waits. However, the longer they wait for a rise in accuracy, the greater the loss of money is for unsuccessful campaigns; thus, causing money to bleed from unsuccessful campaigns or failure to capitalize on potentially successful campaigns.


What is predictive analytics?

For some app developers the linear model for LTV estimation may be sufficient; however, for most app developers a more sophisticated prediction method could be a game-changer.  

The holy grail is to have a method of measuring a user’s app activity during the initial day or two, and then accurately correlate it to long-term LTV. 

The main challenge is that such a correlation is not intuitive. It will require numerous actions and patterns measured over the first couple of hours and days of a user’s journey within the app, and a host of complex tools for analyzing and driving predictions. This field of research is called predictive analytics.

Outside of the marketing industry the science of predictive analytics is used to help analyze historical data and patterns to predict anything from stock market shifts to potential health hazards.

Injecting this science into the world of marketing seems intuitive, but is not easy to conduct. Even today, with the vast commoditization of various data platforms, performing predictive analytics for user LTV requires significant resources and access to a wide variety of data sources.

Interested in learning more about PredictSK?
Join our webinar


The type of method needed include: deep learning, a smart label definition, and dynamic feature engineering. The server costs required in order to run these types of models can be exorbitant.

 While many UA managers might be aware of the benefits of using predictive analytics, this privilege is limited to a lucky few. The vast majority of app marketers do not have the resources to pull such an elaborate operation, leaving them to rely on limited calculation models at best or their gut feeling at worse.


Solving the predictive marketing equation

In order to build and train complex deep learning predictive models that can provide these desired LTV predictions, access to large user behavior databases is needed.

Even if the predictive model only applies each app’s siloed data in-order to generate local predictions, the model’s training and optimization must rely on data from hundreds if not thousands of apps to achieve maximum accuracy. 

Very few companies are privileged enough to enjoy a birds-eye-view of user acquisition properties, including monetization and cost channels, as well as access to all app campaigns across all advertising sources and channels.  

AppsFlyer PredictSK dashboard

Predict dashboard

For example, if a certain advertiser is working with five different ad networks, each network may have access to significant amounts of data, but won’t have exclusive access to all UA campaigns. Their data is thus limited to their own campaigns and media. These media sources, by nature, cannot be unbiased.


Why is this the necessary next step?

Attribution measurement is going through some major changes. As we head into a new, privacy-centric reality we must adopt a new measurement standard. One that requires shorter measurement time frames and applies anonymous user potential scores for decision making.

Predictive marketing does just that!

Leveraging its unique position and massive attribution database, perfectly positions AppsFlyer to achieve reliable and accurate insights. Utilizing a broad ecosystem view, unprecedented human and computing resources, and an unbiased industry position to provide accurate predictive insights in minimal time.

The post Predictive marketing explained – why it matters appeared first on AppsFlyer.

Viewing all 869 articles
Browse latest View live